The best way to monitor an API is to check the endpoints that matter from more than one location, measure latency and errors with percentiles rather than averages, and page a human only when a failure is confirmed and affects users. Everything else in this guide supports those three habits. It is written for engineers who own production services and carry the pager.
TL;DR
- Monitor what users depend on: a short list of critical endpoints and journeys, not every route you have ever shipped.
- Track the four golden signals (latency, traffic, errors, saturation) and read latency as p95 and p99, not as an average.
- Require repeated failures, confirmed from a second location, before an incident opens. That one rule removes most false alarms.
- Page for outages and fast budget burn. Send everything else to a ticket or a status update.
- Review your monitors whenever endpoints, dependencies or traffic change, and test the alert path itself.
Table of Contents
- Start with what the API promises
- Monitor the layers of an API check
- Choose metrics that show real health
- Monitor from outside, and from more than one place
- Set baselines and thresholds you can defend
- Alert on real incidents, not on every blip
- Cover cron jobs and background work
- Design endpoints that are easy to monitor
- Use monitoring data to diagnose and communicate
- Keep the setup healthy over time
- Where AI assistants help
- Know where your monitoring data lives
- Our perspective
- Start monitoring your API
- FAQ
- Sources
Start with what the API promises
Before you add a single check, write down what “working” means. Vague goals produce vague monitors. A useful definition has three parts: which endpoints or journeys count, what a good response looks like, and how much failure you can tolerate.
For a small SaaS team, the list is usually short:
- The authentication or token endpoint. If nobody can log in, nothing else matters.
- The one or two calls your core feature depends on (create an order, fetch a dashboard, ingest an event).
- The health endpoint your load balancer already uses.
- Any public webhook receiver that partners or payment providers call.
- Scheduled jobs that must run on time, such as nightly syncs and billing runs.
If you promise uptime to clients, translate that promise into a number you can measure, such as a monthly availability target, and keep it next to the monitors that prove it. Our guide to incident reporting metrics covers how to report against that number afterward.
Monitor the layers of an API check
A check that only confirms the server answers is the minimum. A good API check works in layers, and each layer catches a different kind of failure.
1. Reachability
Can a client open a connection at all? A TCP port check or a plain HTTP request catches dead processes, closed firewalls and expired routing. It is cheap and fast, and it is the right first layer for any service.
2. Status code
The response should return the code you expect. HTTP groups codes by class, and the 5xx class signals that the server failed to fulfill a request, as the IANA registry of HTTP status codes lists. A 200 from a login page that actually says “database unavailable” is the classic trap, which is why the next layer matters.
3. Response content
Assert something about the body: a field that must exist, a string that must appear, a JSON value that must not be empty. This catches the API that returns 200 with an error payload, or an empty list because a downstream dependency failed quietly.
4. Latency
An API that answers in nine seconds is down for most users even though the status code is perfect. Set a timeout that matches what your clients tolerate, and treat a timeout as a failure.
5. Certificates and domains
A TLS certificate that expires overnight takes an API down as completely as a crashed server, and it is entirely predictable. Watch certificate and domain expiry as separate monitors with plenty of warning, rather than waiting for the first failed handshake.
Choose metrics that show real health
Google’s SRE book states that the four golden signals of monitoring are latency, traffic, errors and saturation, and that if you can measure only four things for a user-facing system, these are the four to focus on. They map neatly onto an API:
| Signal | What to watch on an API | Why it matters |
|---|---|---|
| Latency | Response time at p50, p95 and p99 | Averages hide the slow tail that real users feel |
| Traffic | Requests per second per endpoint | A sudden drop often means clients cannot reach you |
| Errors | Rate of 4xx and 5xx responses, plus wrong-content responses | Separates your failures from client mistakes |
| Saturation | CPU, memory, connection pools, queue depth | Warns you before capacity turns into errors |
Public-sector engineering guidance agrees on the same shape: the UK government’s API monitoring standard lists latency percentiles (p50, p95, p99), request volume including requests per second, 4xx and 5xx error rates and resource utilization as key metrics, and notes that watching CPU and memory can reveal saturation before it hurts performance.
Two practical notes. First, split 4xx from 5xx. A spike in 401s after a deploy is a different problem from a spike in 503s. Second, keep external uptime checks and internal metrics as separate tools. Internal metrics tell you why something is slow; an outside check tells you whether a customer can reach you at all. You need both, and the outside check is the one that still works when your own stack is the thing that broke.
Monitor from outside, and from more than one place
A check run from the same cloud region as your API will happily report success while users in another continent see timeouts. Routing problems, DNS issues and regional provider incidents are invisible from a single vantage point.
Run checks from several regions. Uptime Beacon checks from five: EU Central, EU North, US East, US West and Asia Pacific. Pick the regions where your customers actually are, and compare results region by region when something looks wrong. If one region fails and four are healthy, you are likely looking at a network path problem, not an outage. If all five fail, page someone.

Set baselines and thresholds you can defend
A threshold pulled from the air is the main source of noisy alerts. Use a short process instead:
- Collect a baseline. Run the monitor for a week or two and note p50, p95 and p99 latency at different times of day.
- Set the threshold above normal variation. If p95 usually sits at 300 ms, alerting at 350 ms will fire constantly. Choose a value that means “users are noticing”, not “slightly unusual”.
- Require persistence. A single slow response is noise. Several consecutive slow or failed checks are a signal.
- Write down why. A threshold with a reason attached survives the next engineer’s review. One without gets deleted or ignored.
For availability targets, the arithmetic is worth knowing. A 99.9% monthly target allows roughly 43 minutes of downtime in a 30-day month. Choose the target you can actually keep, and remember that every extra nine costs far more engineering effort than the last.
Alert on real incidents, not on every blip
Most API monitoring failures are not missed outages. They are too many pages for things that fixed themselves, until the team starts ignoring the pager.
Confirm before you page
The most effective single change is to require several failures in a row, then confirm from a second location. A dropped packet on one network path does not open an incident. A repeated failure seen from two places does. This is how Uptime Beacon works: an incident opens only after repeated failures, with confirmation from a second region on paid plans. Our write-ups on reducing alert noise without missing real incidents and on SaaS uptime monitoring that pages only for real failures go deeper on tuning.

Tier alerts by urgency
Not everything deserves a phone call. A workable split:
- Page: complete outage on a critical endpoint, a breached customer-facing commitment, fast error-budget burn.
- Ticket or chat message: slow degradation, a certificate expiring within weeks, a non-critical endpoint failing.
- Status page update: customer communication once you know the scope.
Alert on error budget burn, not just on thresholds
If you run service level objectives, Google’s SRE Workbook describes alerting on how fast the error budget is consumed. For a 99.9% SLO, it recommends paging at burn rates such as 14.4 (2% of budget in one hour) or 6 (5% in six hours), and opening a ticket at a burn rate of 1 (10% in three days). The logic is sound for any team: a fast burn is an emergency, a slow burn is a work item.
Cover cron jobs and background work
APIs rarely stand alone. Behind them sit workers, queues and scheduled jobs, and these fail silently: nothing returns an error because nothing runs. The reliable approach is a heartbeat. The job pings a URL when it finishes, and the monitor alerts if the ping does not arrive on schedule. Add a heartbeat to every job whose absence a customer would eventually notice. Our overview of API and cron monitoring for SaaS teams shows how the two fit together.
Design endpoints that are easy to monitor
Monitoring is easier when the API cooperates. A dedicated health endpoint should check the dependencies that matter (database, cache, a critical upstream) and return a clear status without being expensive to call. Keep it unauthenticated or protect it with a simple token, and do not let it leak internals. We cover the design trade-offs in API health checks: endpoint design and monitoring, and the broader checklist in API uptime monitoring: what to check and how to alert.
Use monitoring data to diagnose and communicate
When an alert fires, the first questions are always the same: since when, from where, and what changed. Good monitoring data answers them fast:
- Check history shows the exact minute the failure began, which you can line up against deploys.
- Region-by-region results tell you whether the problem is global or local.
- Response details (status, timing, body assertion that failed) separate a crash from a slow dependency.
For deeper diagnosis, send traces and logs into your internal tooling. The OpenTelemetry Collector is a vendor-neutral way to receive, process and export telemetry, including retries, batching and filtering of sensitive data.
Communication matters as much as diagnosis. Post to your status page early, say what you know and what you do not, and update on a rhythm. Host the status page somewhere independent of your own dashboard, or it will go down with the thing it reports on. Afterward, track how long recovery took; our piece on mean time to recovery explains why a single outage can produce three different MTTR numbers.
Keep the setup healthy over time
Monitors rot. Endpoints get renamed, auth schemes change, a dependency moves, and the check keeps passing against something that no longer matters, or fails forever against something that no longer exists.
- Review monitors whenever you ship a new endpoint or retire an old one. Make it part of the release checklist.
- Test the alert path. Pause a staging monitor, break an assertion on purpose, and confirm the right person gets the right message.
- Prune alert rules quarterly. Any alert that fired and led to no action is a candidate for a higher threshold or removal.
- Use maintenance windows for planned work so deploys do not generate incidents.
- Keep ownership clear. Every monitor should have a named team and a route to a human.
Where AI assistants help
A growing part of the review work can be handed to an assistant. Uptime Beacon runs an MCP server on every plan, Free included. You connect Claude, ChatGPT, Cursor, VS Code, Codex or any MCP client, sign in, and there is no API key to manage. The assistant can read monitors, incidents and check history, and diagnose a failing monitor region by region. If a team turns on “Allow changes”, it can also create, pause and resume monitors, acknowledge incidents and start maintenance windows. Nothing can be deleted over MCP. In practice that means you can ask “which monitors failed in the last day, and from which regions?” from the editor you already have open. Our post on AI incident response for on-call teams shows the workflow.
Know where your monitoring data lives
If you serve EU customers or operate under GDPR, monitoring results are data too: URLs, response bodies you assert on, and timing history. Decide where they are stored, how long they are kept and who can export them. A good retention policy names the data classes, storage regions, retention periods and deletion procedures, and it accounts for replicas, backups and caches. Uptime Beacon stores every result on a control plane and database in the EU, operated by Wealth Beacon OÜ in Estonia. Whatever tool you use, ask for the same specifics in writing.
Our perspective
We have spent more than 30 years combined running production in banking, fintech, telecom and SaaS, and the pattern repeats everywhere: the monitoring that fails teams is rarely the monitoring that misses an outage. It is the monitoring that cries wolf until nobody believes it.
That is why Uptime Beacon opens an incident only after repeated failures, confirmed from a second location on paid plans. An on-call engineer should be woken by a real problem, not by a network blip between one probe and one server.
We also think the next layer of monitoring lives where engineers already work. Having an assistant read check history and walk through a failing monitor region by region, on every plan, turns the first ten minutes of an incident from tab-hunting into a question and an answer. And because status pages should work when everything else does not, ours do not depend on the dashboard.
The best practice we would put above all the others is simple: trust your pager.
Aaditya Parashar
Start monitoring your API
The Free plan is built for exactly this first pass: 5 monitors every 5 minutes from EU Central, one alert channel (email or Slack) and one status page, with no card required. Point it at your authentication endpoint, your core API call and your health check, and you have the foundation of everything above.
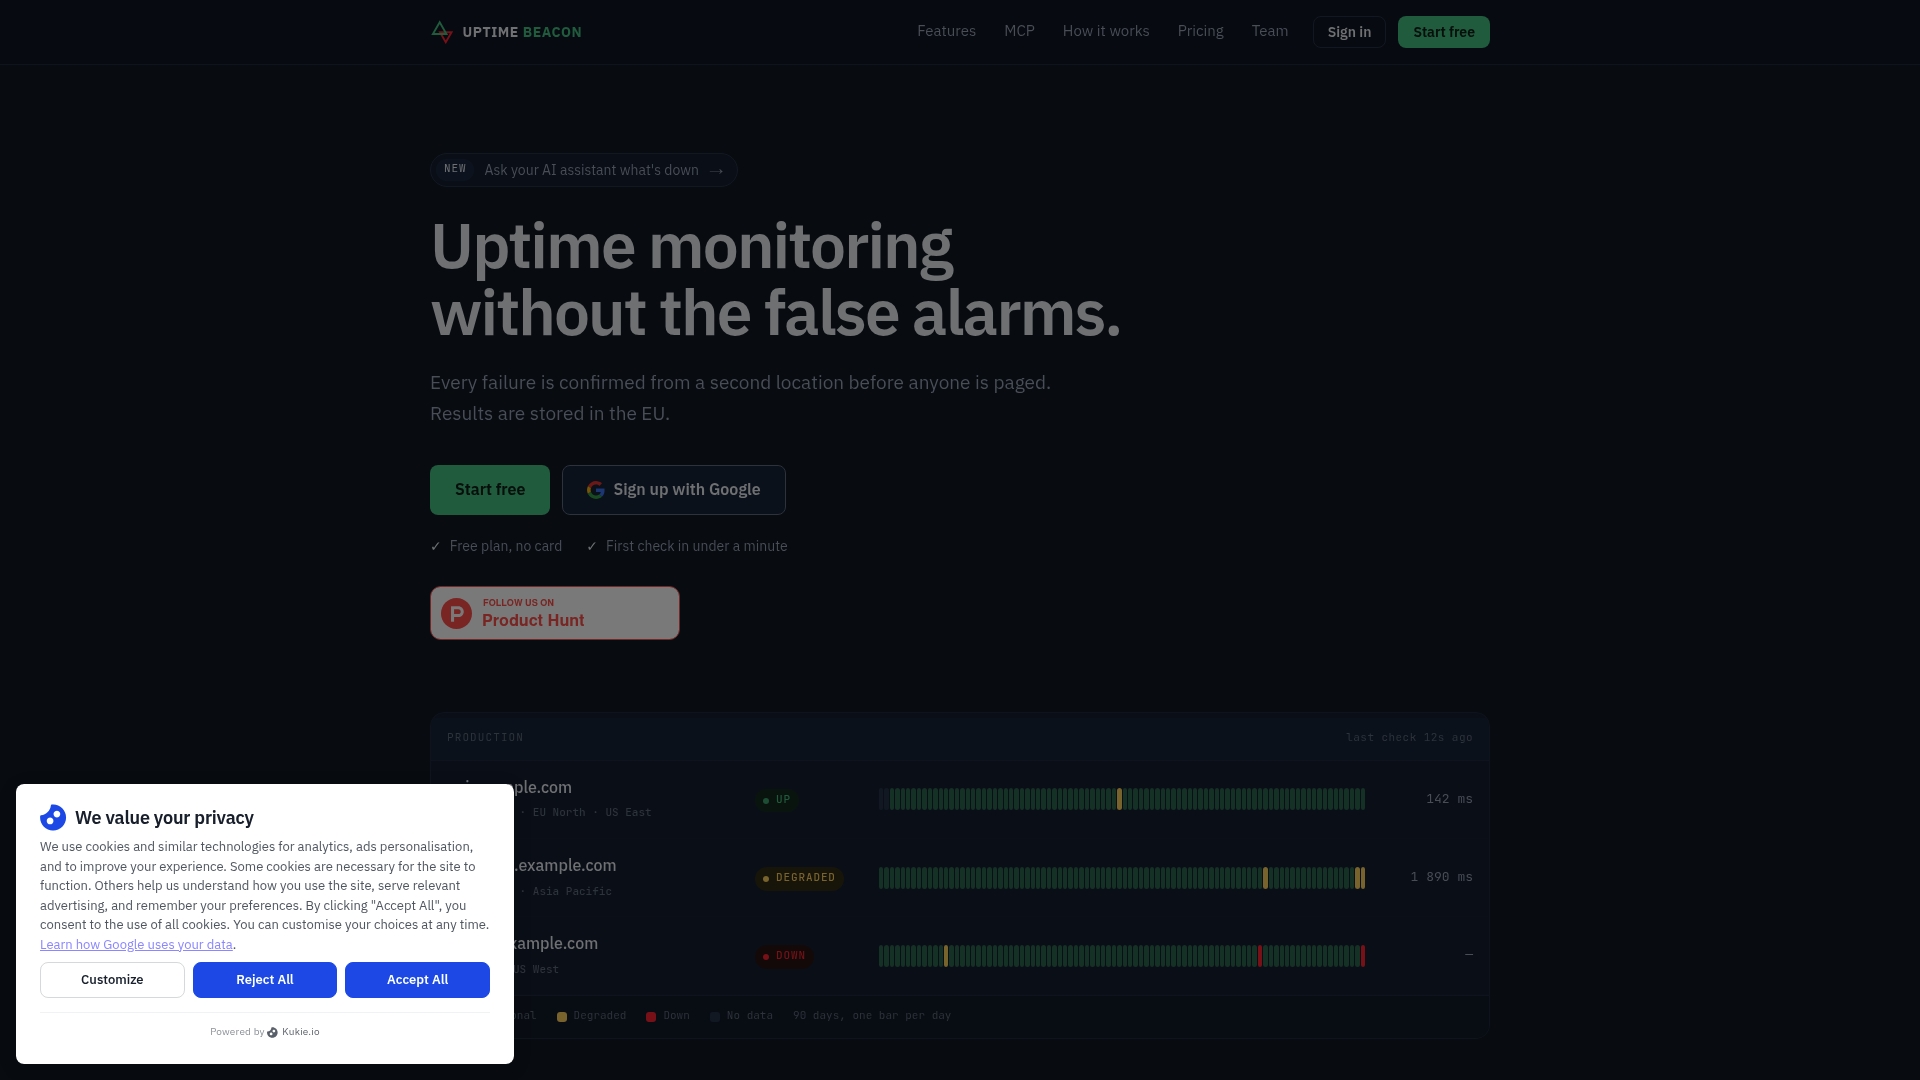
When you need more, Starter is €14.99 per month, Pro is €39.99 per month and Business is €89.99 per month, with extra monitors available as add-ons from €5 per month. Enterprise is available with no published price. See the plans on the Uptime Beacon homepage, or read how API and cron monitoring for SaaS teams fits a small production stack.
FAQ
How often should I check an API?
Match frequency to impact. Critical endpoints deserve the shortest interval your plan allows, while secondary endpoints can run less often. Pair the interval with a confirmation rule, so a faster schedule finds outages sooner without producing more false alarms.
What should I monitor first on a new API?
Start with the authentication endpoint, the single call your core feature depends on, and a health endpoint that checks your database. Add a certificate expiry watch and a heartbeat for each important scheduled job. Five monitors cover this for most small services.
Why use more than one location?
A single location cannot tell the difference between your API failing and the path to your API failing. Confirming a failure from a second region before opening an incident removes most one-off network errors, and region-by-region results show whether an outage is global or local.
Is a 200 response enough to call an API healthy?
No. Many failures return 200 with an error body or an empty result. Add an assertion on the response content, and a latency limit, so the check fails when the API is technically answering but practically broken.
Sources
- Chapter 6: Monitoring Distributed Systems, Google SRE book
- Alerting on SLOs, Google SRE Workbook
- Monitoring and Observability, UK government API design guidelines
- OpenTelemetry Collector documentation
- HTTP Status Code Registry, IANA


