SaaS uptime monitoring measures whether real users complete real requests, so you need external synthetic checks and internal SLIs working together. The goal is to catch user-impacting failures without paging anyone for noise.
TL;DR:
- For a 30 day month, 99.9% availability permits 43.2 minutes of downtime, while 99.99% permits 4.32 minutes and 99.999% just 25.9 seconds.
- Small teams should begin with two or three critical journeys, define one customer facing indicator for each, and tighten targets only when measured performance supports it.
- Each check should verify content or a token, not merely status, and repeated failures need confirmation from another region before paging.
- External checks detect user visible symptoms; internal metrics, logs, and traces help locate causes, while latency percentiles reveal slow requests averages can hide.
- Page engineers for user facing outages or error budget burn, send messages for degradations, and keep nonactionable fluctuations on dashboards for daily review.
Table of Contents
- Why does hosting uptime not tell you if your SaaS is really up?
- How do white-box and black-box monitoring work together?
- What are SLIs, SLOs and error budgets, and what do the nines mean?
- Which signals and user journeys should you monitor in a SaaS product?
- How should you design synthetic checks that do not cry wolf?
- How do you keep alerts actionable and protect your on-call team?
- What do SRE and OpenTelemetry practitioners recommend in practice?
- What would we prioritize if we ran a small team?
- Get fewer false alarms with multi-location confirmation
- FAQ
- Sources
Why does hosting uptime not tell you if your SaaS is really up?
A hosting SLA tells you the servers answered. It does not tell you whether a customer could sign in. For a SaaS product, availability is the proportion of user requests that succeed, and that is a different number from “the VM was running.”
Hosting guarantees miss a long list of failures: a login flow that returns errors while the homepage still serves 200 OK, an API authentication service that times out, a checkout that fails only for one payment path, or a partial degradation where a fraction of requests fail. Third-party dependencies add more risk. An identity provider, an email service or a payment gateway can break your product while your own infrastructure looks perfect. DNS mistakes, expired certificates and a bad release can do the same.
When an external probe reports a failure, work through this checklist before anything else:
- DNS: does the record resolve correctly from more than one location?
- Certificates: is the TLS certificate valid, complete in its chain and not near expiry?
- Recent deploys: did a release, feature flag or config change land just before the failure?
- Third-party services: are your auth, payment, email or CDN providers reporting incidents?
- Edge and load balancer: do health checks and routing rules still match what the app serves?
- Regional scope: is the failure global, or limited to one probe location?
Google’s SRE guidance on product-focused reliability makes the same point: internal logs can miss client-side failures and edge-case latency that users feel directly. Define “up” the way your customers experience it, then measure that.
How do white-box and black-box monitoring work together?
You need both, because each one sees what the other cannot.
White-box monitoring looks from the inside. It covers metrics, logs and traces emitted by your own code and infrastructure, and it is what you reach for when debugging and when deriving SLIs such as error rate and latency. Black-box monitoring, usually called synthetic monitoring, looks from the outside. It sends real requests the way a user would, so it finds problems that never show up in your internal telemetry: a broken CDN route, a DNS failure, a certificate problem, a client-facing error page.
Examples of checks worth implementing:
- White-box: request error rate per endpoint, latency percentiles, such as p99, queue depth, database connection saturation.
- White-box: traces that show which downstream call made a request slow.
- Black-box: an HTTP check on a login endpoint with a body assertion, not just a status code.
- Black-box: a TCP port check on a database proxy or mail gateway, plus a certificate expiry watch.
The rule of thumb: use black-box checks to detect the symptom, and white-box data to find the cause. Page on symptoms users would notice, then open dashboards and traces to explain them.
Pro Tip: If a failure is visible only in white-box data, ask whether users are affected. If they are not, it is a dashboard item, not a page.
What are SLIs, SLOs and error budgets, and what do the nines mean?
A service level indicator (SLI) is a measurement of user-facing behavior, such as the share of requests that succeed or the share served under a latency threshold. The Google SRE book stresses picking a small, representative set of indicators, because many metrics dilute attention.
An error budget is the amount of failure allowed under an SLO. When you burn through it, that is the signal to slow feature work and spend time on reliability, as Stytch’s overview of SLAs and error budgets describes.
For a 30-day month, 99.9% availability allows 43.2 minutes of downtime, 99.99% allows 4.32 minutes, and 99.999% allows 25.9 seconds. Each extra nine cuts the allowance by a factor of ten and costs far more to achieve, because it demands redundancy, tighter deploy practices and faster recovery.

For a small team, start modestly. Choose a target you can explain to a customer and defend to your own team, run it for a while, and tighten it only when the data says you can. An SLO nobody believes becomes an SLO nobody uses.
Which signals and user journeys should you monitor in a SaaS product?
Start from the four golden signals described in the Google SRE monitoring chapter: latency, traffic, errors and saturation. Then map each one onto the journeys that matter to customers, because a signal with no user journey attached is hard to act on.
- Latency and errors on critical journeys. Track how long login, API authentication and checkout take, and how often they fail, separately from your overall averages.
- Synthetic journey checks. Bundle HTTP, DNS, SSL and TCP assertions for each journey, since a 200 OK on the homepage can hide a broken login or token exchange.
- Traffic baselines. Watch request volume per endpoint so a sudden drop, often a sign of a broken client or route, gets noticed as quickly as a spike.
- Saturation indicators. Keep an eye on connection pools, queue depth and worker capacity, which predict failures before users see them.
- Heartbeats for scheduled work. Have every cron job, backup and billing run check in on schedule, so silence triggers an alert.
- Certificate and domain expiry. Watch expiry dates well ahead of time; this failure is entirely preventable.
- A status page that survives incidents. Host it separately from your product and dashboard, so customers can still read it when everything else is down.
How should you design synthetic checks that do not cry wolf?
Treat synthetics as code. Practitioners building on tools like AWS CloudWatch Synthetics describe multi-check blueprints that bundle HTTP, DNS, SSL and TCP assertions for one user journey. Keep them in version control, review changes, and update them with the feature they test.
- One blueprint per journey: group related assertions so a single failed step tells you where the journey broke.
- Assert on content, not just status: check for a token, a field or a page element that proves the feature works.
- Match frequency to purpose: a regular check suits a high-stakes endpoint, but polling a low-traffic page very frequently adds load and noise without improving detection much.
- Probe from several regions: a single location cannot tell a real outage from a local network problem.
- Confirm before you alert: require repeated failures, then verify from a second location before opening an incident.
Portable tooling helps here too. The OpenTelemetry project added HTTP synthetic testing through its Collector, exporting duration, status and error metrics into the tools you already use.
Pro Tip: Name each check after the user outcome (“customer can sign in”), not the URL it hits. Alerts then read like impact statements.
How do you keep alerts actionable and protect your on-call team?
Alert on symptoms and SLO burn, not on every low-level fluctuation. A CPU spike that no customer feels should not wake anyone. Alert fatigue is a well-known operational problem, and teams reduce it by tightening alert logic, adjusting SLOs where they were unrealistic, and automating fixes or suppression for repetitive non-actionable alerts, as Sensu’s write-up on alert fatigue explains.
- Confirmation windows: open an incident only after several consecutive failures, confirmed from another location.
- Severity levels: page for user-facing outages, send a message for degradations, and log the rest.
- Maintenance suppression: silence expected alerts during planned work, then resume automatically.
- Aggregation: collect subcritical issues on a dashboard that someone reviews daily.
- Runbooks and reviews: attach a short runbook to every paging alert and hold a blameless review after real incidents. Our incident response playbook includes a checklist you can adapt.
Pro Tip: Periodically, count pages per engineer and list every alert that led to no action. Delete or demote each one.
What do SRE and OpenTelemetry practitioners recommend in practice?
Three techniques show up repeatedly in SRE guidance and community tooling. First, use latency histograms and percentiles instead of averages. An average hides the slow tail, and the tail is where frustrated users live, so correlate p99 latency with error rates. Second, combine telemetry types: the SRE workbook on monitoring describes metrics for rapid alerting and dashboards, with logs reserved for root-cause analysis. Third, make checks portable and repeatable by running them through OpenTelemetry or similar tooling and shipping them through CI/CD alongside the code they protect.
Google’s SRE guidance says to combine white-box instrumentation with black-box external monitoring, because internal data alone can miss failures users actually experience. If your first SLIs are hard to measure with probes, the SLO implementation workbook suggests starting with sources that need minimal engineering work, such as existing server logs or load balancer metrics.
What would we prioritize if we ran a small team?
Fewer things, measured well. Pick two or three user journeys, define one SLI for each, and set an SLO modest enough that you would hit it today with a little room to spare. Tighten it only once the data shows you can. Most small teams do not suffer from too little monitoring; they suffer from alerts nobody trusts. Confirming failures from a second location and setting sensible thresholds does more for on-call health than any new dashboard. A well-chosen 99.9% you actually defend beats a 99.99% that exists only in a slide deck.
— Aaditya Parashar
Get fewer false alarms with multi-location confirmation
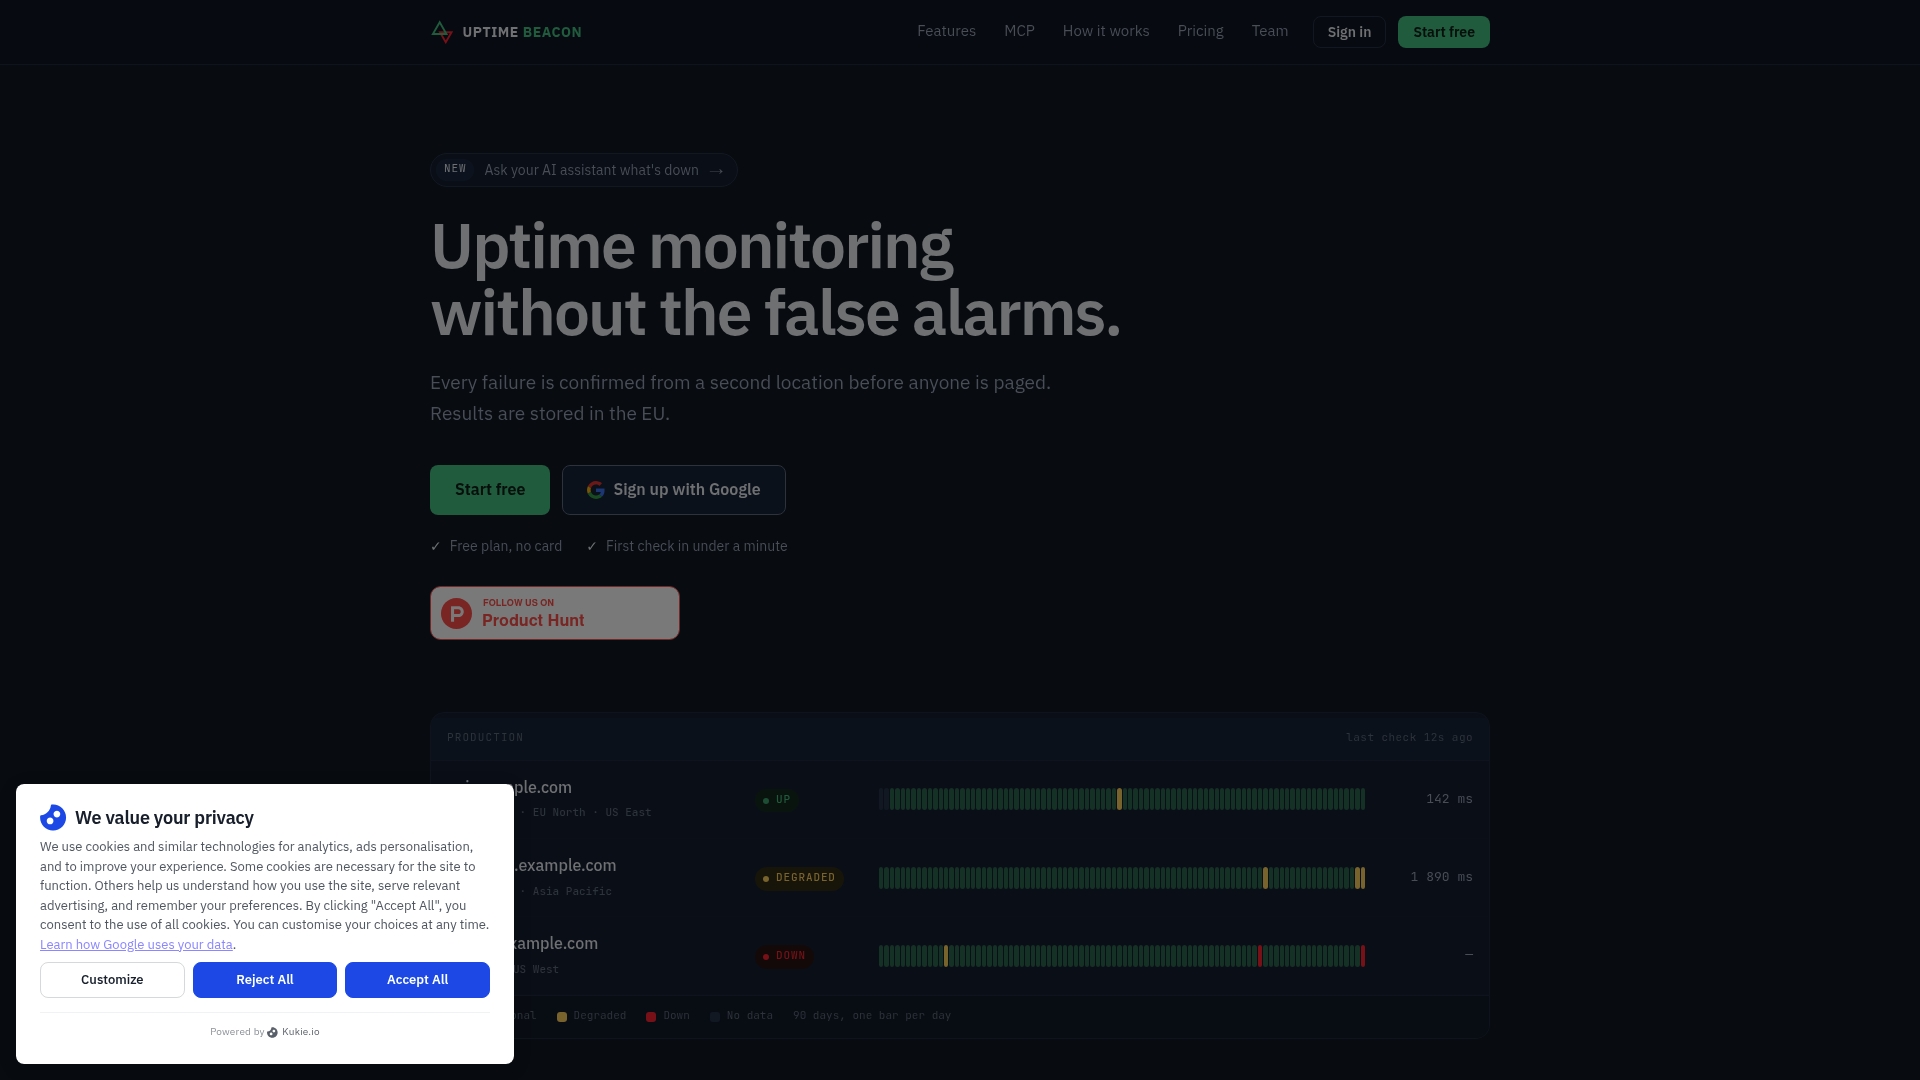
At Uptime Beacon, we built our monitoring around the problem this article describes: pages that wake engineers for nothing. An incident opens only after several failures in a row, and paid plans confirm it from a second location. Our MCP server, available on every plan including Free, lets Claude, ChatGPT or Cursor read your monitors and diagnose failures region by region. Start on the Free plan, no card, and see how it feels at Uptimebeacon.
FAQ
What is the best tool for monitoring uptime?
A suitable tool checks from several locations, confirms failures before alerting, and matches your team’s size and budget. Look for support for HTTP, TCP, heartbeat and certificate checks, plus alerting to the channels you already use. A free tier lets you test it on real services before committing.
How do you calculate SaaS availability?
Availability is the share of successful requests (or minutes) out of the total in a window. For a 30-day month, 99.9% allows 43.2 minutes of downtime. Many modern teams prefer measuring the percentage of failed operations over classic MTBF, since replicas and partial degradations make single-server metrics misleading.
What are the main types of SaaS monitoring tools?
They fall into a few groups: external synthetic and uptime monitors, application performance and observability platforms that collect metrics, logs and traces, and status page tools. Most teams combine an external monitor for symptoms with internal instrumentation for diagnosis.
How do you check the uptime of a SaaS service?
Run an external check against a user-facing endpoint at a regular interval, and assert on content as well as the status code. Add a probe from a second region, then track the success rate over your SLO window. Public status pages from providers help you check dependencies.


