The incident reporting metrics worth tracking are the number of incidents, time to detect, time to acknowledge, time to recover, and impact per incident, all split by severity. Define each one in writing, measure it from timestamps your tools record on their own, and report medians and distributions next to the averages. Everything else is decoration.
This guide covers what each metric means, where the usual definitions go wrong, how to lay out an incident report, and how to feed the numbers from your monitoring instead of from memory.
TL;DR
- Track five things: incident count, time to detect (MTTD), time to acknowledge (MTTA), time to recover, and user impact. Split every one by severity.
- “MTTR” stands for at least four different measurements. Write down which one you mean before you put it on a chart.
- Averages mislead. Report the median and the worst case next to the mean, and never compare a P1 with a P4.
- A report is only useful if each incident has an owner, a root cause and follow-up actions. Metrics without that are paperwork.
- False alarms corrupt every number downstream. Fix detection first, then measure.
Table of Contents
- The metrics that earn a place in your report
- Why averages mislead
- Targets: what do good numbers look like?
- What a good incident report contains
- Reporting to different audiences
- Garbage in: how false alarms ruin your metrics
- Perspective: measure fewer things, from cleaner signals
- Pulling the numbers from your monitoring
- Start with the free plan
- Common mistakes to avoid
- FAQ
- Sources
The metrics that earn a place in your report
Most teams track too many numbers and trust too few. A short set, defined precisely, beats a dashboard with thirty tiles. NIST guidance on incident response metrics points to the same small core: the number of incidents plus the core response times. It treats them as operational controls, meant to manage and improve how incidents are handled, with standardized definitions so results are comparable between reports.
Here is that core, with the extra metrics a production team usually needs.
| Metric | What it measures | Clock starts | Clock stops |
|---|---|---|---|
| Incident count | How often service breaks | n/a | n/a |
| MTTD (time to detect) | How fast you learn something is wrong | Failure begins | Alert or incident opens |
| MTTA (time to acknowledge) | How fast a human takes ownership | Alert fires | Someone acknowledges |
| Time to recover | How long users are affected | Failure begins | Service works again |
| Incident duration | The whole event, start to close | Failure begins | Incident closed |
| Impact | Who and what was hurt | n/a | n/a |
The split between detect, acknowledge and recover matters because each points at a different fix. A long MTTD is a monitoring problem. A long MTTA is a paging, rota or alert-fatigue problem. A long recovery is a runbook, tooling or architecture problem. One blended number hides which of the three you should work on.
Incident count and frequency
Count incidents per week or month, by severity. A rising count of low-severity incidents can be healthy if you are detecting problems earlier. A rising count of P1s never is. Be careful with the denominator too: ten incidents across five services is different from ten across five hundred.
One trap sits at the front of this metric. If your monitor opens an incident for every dropped packet, the count measures your alerting noise, not your reliability. Decide what qualifies as an incident, and make sure the tool enforces it.
MTTD: time to detect
Rootly’s metrics reference defines MTTD as the average time between when an incident occurs and when it is identified. The hard part is the start time. You rarely know the exact moment a failure began, so use the first failed check or the first error in your logs, and say so in the report. Be consistent: if one engineer uses the first customer complaint and another uses the first failed probe, the numbers are not comparable.
Check interval puts a floor under MTTD. A monitor that runs every five minutes cannot detect a failure faster than its next run. Confirmation rules add time too, which is the honest price of fewer false pages. More on that trade-off below.
MTTA: time to acknowledge
MTTA is the gap between an alert firing and a human starting work on it. It tells you whether your on-call setup works: whether the right person is paged, whether the page is trusted, and whether people are sleeping through noise they have learned to ignore. A creeping MTTA is often a symptom of alert fatigue, not of lazy engineers.
Time to recover, and the four MTTRs
This is where reports go wrong. Rootly lists MTTR as respond, repair, recover or resolve, and each measures a different slice of the lifecycle. NIST-style reporting also separates time to respond from time to recover. If your quarterly report says “MTTR: 42 minutes” and nobody can say which MTTR, the number cannot support a decision.
We worked through one outage measured three different ways in Mean Time to Recovery: One Outage, Three Different MTTRs. The short version: pick one definition, publish it at the top of the report, and keep it for at least a year.
Impact
Impact is the metric executives and customers care about, and the one engineering dashboards skip. Record the number of users or requests affected, the duration of degraded service, and any SLA consequence. ITIL 4 guidance frames incident management around service restoration and user impact, and the same source lists SLA compliance and customer satisfaction alongside first-time resolution among its central KPIs. It also makes a post-incident review mandatory for all P1 incidents.
Why averages mislead
A mean is easy to compute and easy to distort. One eight-hour outage drags the monthly average up so far that twenty fast recoveries become invisible. A burst of tiny blips pulls it down and flatters you.
Google’s SRE team has written directly about this. Its incident metrics report notes that statistics like MTTR are often used to evaluate improvements or track trends, and then tests that practice with a Monte Carlo simulation and statistical analysis. The upshot is that a simple average can mislead when you try to judge whether a process change actually helped.
What to do in practice:
- Report the median and the 90th percentile next to the mean. The median shows the typical incident, the percentile shows how bad the bad ones get.
- Segment by severity. A P1 and a P4 should never share an average.
- Show the raw list of the longest incidents under the chart. Three rows with a sentence each will teach the reader more than the trend line.
- Do not declare victory from one quarter. With a small number of incidents, random variation can look like improvement.
If you have fewer than about ten incidents in a period, a table of each incident is more honest than any average.
Targets: what do good numbers look like?
Benchmarks help you calibrate, as long as you remember they describe software delivery teams in general, not your system. The DORA thresholds as configured in Digital.ai’s dashboard put the general bar at a change failure rate under 15% and time to recover under 24 hours, with elite performers at 5% or less and under one hour respectively.
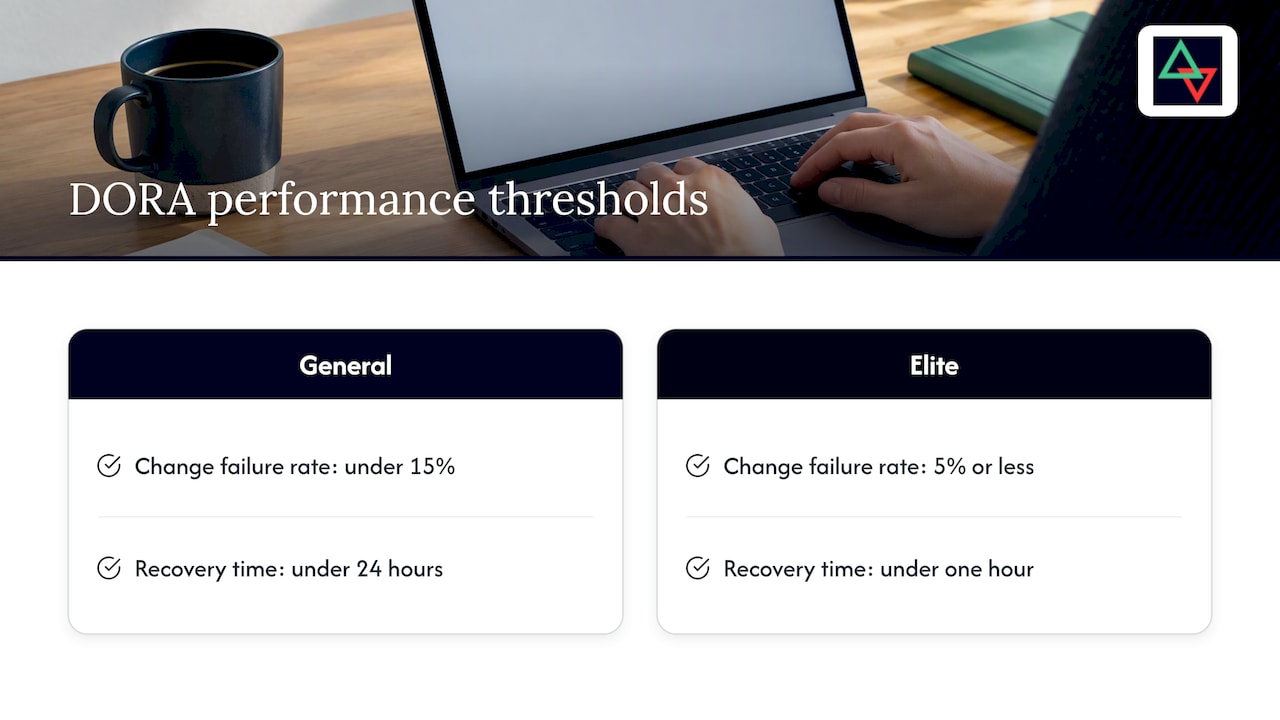
Use those as a sanity check, not a goal. A static marketing site and a payments API should not share a recovery target. Set targets per service tier, based on what an hour of downtime costs you and what you have promised customers in your SLA.
What a good incident report contains
Metrics are the summary. The report is the record. Slack’s incident summary template lists the fields a complete report needs: date and time, incident type, who was involved and in what role, a detailed description, business impact, immediate actions taken, root cause, and follow-up tasks with owners. It also notes that formal post-mortem meetings are typically held within two weeks of closing the incident.
Here is a layout that works for a small engineering team. Copy it into your wiki and delete what you don’t need.
A template you can reuse
Title: [Service] [symptom], [date]
Severity: P1 / P2 / P3
Status: Resolved
Owner: [name]

Timeline (UTC)
- hh:mm  First failed check
- hh:mm  Incident opened
- hh:mm  Acknowledged by [name]
- hh:mm  Mitigation applied
- hh:mm  Service confirmed recovered

Metrics
- Time to detect:
- Time to acknowledge:
- Time to recover:
- Users / requests affected:
- SLA impact:

What happened (3-5 sentences, plain language)
Root cause
What went well / what did not
Follow-ups: action, owner, due date
Two habits make this template work. First, write timestamps in UTC so a team across time zones reads one timeline. Second, give every follow-up an owner and a date. An action item with no owner is a wish.
Example: a short incident summary
This is an illustrative example, not a real event.
Checkout API returned 503 errors, P1. First failed check 14:02 UTC, incident opened 14:07, acknowledged 14:09, rollback finished 14:31, recovery confirmed 14:34. Time to detect: 5 minutes. Time to acknowledge: 2 minutes. Time to recover: 32 minutes. Cause: a connection pool setting shipped in the 13:55 deploy. Follow-ups: add pool size to the pre-deploy checklist (owner: platform lead, due in one week); add a synthetic checkout check (owner: on-call engineer, due Friday).
Notice what is absent: blame, adjectives and speculation. It states times, cause and actions. For a method to check that the cause you wrote is the real one, see our root cause analysis guide.
Reporting to different audiences
The same incident needs different summaries for different readers.
- On-call engineers and SREs want the raw timeline, per-region check results and the exact failing request. They use internal dashboards.
- Engineering managers want trends: counts by severity, median recovery, repeat causes, overdue follow-ups.
- Executives and boards want business risk. N-able’s security team advises translating technical measures into stakeholder language, for example turning MTTD into how long a threat persisted before discovery, while leaving the operational detail to internal dashboards.
- Customers want to know what broke, whether it is fixed and what you changed. A public status page and a short written summary do this best.
Do not send the executive a latency histogram, and do not send the on-call engineer a quarterly narrative.
Connect the report to your framework
If you answer to auditors or follow NIST or ITIL, map each action item to the control or practice it supports. Reflex Security’s write-up of the NIST SP 800-61 revision notes that the newer guidance treats improvement as a continuous loop. A post-mortem that never links back to controls is hard to defend as continuous improvement. Our incident response playbook guide shows a first-hour checklist with a NIST mapping.
Garbage in: how false alarms ruin your metrics
Every metric above depends on one assumption: that an incident means something real. If a single failed probe from one network path opens an incident, then:
- Incident count inflates with noise.
- MTTA worsens, because engineers learn to wait before reacting.
- MTTR looks great, because blips “recover” in a minute, and the average improves for the wrong reason.
- The on-call rota burns out.
The fix is at the source. Require several consecutive failures, and confirm from a second location before declaring an incident. That adds a short delay to MTTD in exchange for a record you can trust. Our piece on AI incident response for on-call teams goes into why confirming at two locations matters.
If you change confirmation rules, note the date in your report. MTTD before and after the change measures different things.
Perspective: measure fewer things, from cleaner signals
We build uptime monitoring for engineers who carry the pager, and the most common mistake we see is not a missing metric. It is a noisy source. A team that opens an incident on every single failed check ends up with hundreds of “incidents” a month, and every ratio built on them is quietly meaningless.
That is why Uptime Beacon opens an incident only after several failures in a row, confirmed from a second location on paid plans. We would rather add a little to detection time than wake someone for a network blip. The incident record that results has real start, acknowledge and recovery timestamps, and those are the raw material for honest reporting.

Our founders have more than 30 years combined running production in banking, fintech, telecom and SaaS. What that experience taught us is simple: nobody reads a 40-chart dashboard at 3 a.m. Pick the handful of numbers you will act on, define them in writing, and review them with the people who were paged.
We also think the next improvement is in the investigation step. With MCP, an AI assistant can read your monitors, incidents and check history, and diagnose a failing monitor region by region. That shortens the part of the timeline where an engineer is just gathering facts, and it works on every plan, Free included. Used read-only, it cannot change anything. With “Allow changes” turned on for a team, it can create, pause and resume monitors, acknowledge incidents and start maintenance windows. Nothing can be deleted over MCP.
— Aaditya Parashar
Pulling the numbers from your monitoring
Collecting metrics by hand from chat scrollback is the reason most reports are wrong. A simple workflow:
- Use monitoring timestamps as the source of truth for first failure, incident opened and recovered.
- Record acknowledgement in the tool, not in chat, so MTTA is computed rather than remembered.
- Tag each incident with severity and affected service when it closes.
- Export or query monthly, then compute median, 90th percentile and count per severity.
- Review the three worst incidents in a meeting, and check that every follow-up has an owner.
Two more signals belong in the same review. Expiring certificates and domains cause outages that are entirely predictable, so count them separately and watch them ahead of time; see certificate expiry monitoring. And if you run cron jobs or background workers, heartbeat monitoring catches the jobs that stop silently, which otherwise never appear in any incident count.
For SaaS teams running APIs and scheduled jobs, our API and cron monitoring page shows how those checks fit together.
Start with the free plan
Uptime Beacon’s Free plan costs €0 per month, needs no card, and includes 5 monitors checked every 5 minutes from EU Central, one alert channel (email or Slack) and one status page. The MCP server is included, so you can connect Claude, ChatGPT, Cursor, VS Code or Codex to https://app.uptimebeacon.eu/mcp and ask for a region-by-region diagnosis of a failing monitor. Paid plans start at €14.99 per month (Starter), then €39.99 (Pro) and €89.99 (Business); Enterprise has no published price. Second-location confirmation and maintenance windows come with paid plans. See the plans and start tracking incidents from real signals.
All results are stored on a control plane and database in the EU, which matters if your customers or auditors ask where monitoring data lives.
Common mistakes to avoid
- Reporting one MTTR. Split detect, acknowledge and recover, and say which MTTR you use.
- Averaging across severities. Keep P1s on their own line.
- Optimizing for ticket closure. ITU Online’s ITIL 4 analysis makes the point that restoring service and keeping user confidence matter more than throughput. Closing tickets fast is not the same as fixing things.
- Changing definitions silently. Version your metric definitions like code.
- Skipping the follow-up review. A report nobody reads after the incident closes is a filing exercise.
- Counting only what paged you. Silent failures, expired certificates and dead cron jobs are incidents too.
FAQ
What are the key metrics used in incident management?
The core set is incident count, mean time to detect, mean time to acknowledge, time to recover and impact, each split by severity. ITIL-oriented teams add SLA compliance, first-time resolution and customer satisfaction. Start with the first five and add others only when you will act on them.
What are the 5 elements of a good incident report?
A good report states what happened and when, who was affected and how badly, what was done to stop it, the root cause, and follow-up actions with named owners and dates. Fuller templates, like the one above, add a timeline, severity and the people involved.
How soon should we hold a post-mortem?
The NIST lifecycle summary from OpenExamPrep says the lessons-learned review should happen within two weeks of incident closure. In practice, sooner is better while memories are fresh, and P1s should always get one.
Is MTTR a good metric on its own?
No. The term covers several different measurements, and a mean hides outliers. Use a clearly defined recovery time, report the median and a high percentile, and look at incidents individually when you have only a few.
Sources
- NIST SP 800-61: Incident Response Metrics (Daydream)
- Incident Response Metrics: MTTD, MTTR, MTTA and More (Rootly)
- Incident Metrics in SRE (Google)
- Configuring DORA Industry Standards (Digital.ai)
- Incident Management: Process and Workflows, ITIL 4 (Digital Kimya Docs)
- Incident summary template (Slack)
- Security Incident Response Metrics (N-able)
- NIST 800-61r3 Changes (Reflex Security)
- Top 10 KPIs to Track Incident Management Effectiveness (ITU Online)
- NIST Incident Response Lifecycle (OpenExamPrep)


