Mean time to recovery is the average time between when an incident starts and when service is restored for users. Teams track it because it converts outages into a single, comparable number tied to user pain and SLO health. This guide covers the calculation, the components worth separating, realistic benchmarks, and the tactics that move the number fastest.
TL;DR:
- Repair, recovery, and resolution can yield different MTTRs; use restoration for users when SLOs protect service, and document consistent start and stop rules.
- A 55 minute average from incidents lasting 20, 45, and 100 minutes masks severity differences, so report MTTR separately by incident tier.
- DORA places elite restoration under an hour and high performance under a day, but set SLO targets by service criticality and incident mix.
- Audit incidents by detection, acknowledgment, diagnosis, and repair; diagnosis is often the most variable segment, while symptom alerts and captured traces cut delays.
- False alarms can make MTTR look shorter while delaying real responses; confirm failures across independent regions and consecutive checks before opening incidents.
Table of Contents
- Repair, Recover, Resolve: Pick One Meaning and Stick With It
- How to Calculate MTTR: Formula, Timestamps and Scoping
- Breaking MTTR Into Detection, Diagnosis, Repair and Validation
- What DORA’s Benchmarks Say About Good Recovery Time
- Tactics That Actually Shrink Recovery Time
- Incident Roles, Postmortems and Measurement Hygiene
- How Monitoring Design and AI Assistants Cut Diagnosis Time
- Why False Alarms Distort Your MTTR Numbers
- A Practitioner’s View on Chasing the MTTR Number
- A Monitoring Setup Built Around Fewer False Pages
- FAQ
- Sources
Repair, Recover, Resolve: Pick One Meaning and Stick With It
MTTR is one acronym with at least four different definitions depending on which “R” you mean. The ambiguity is not academic. Mean time to repair, recover, resolve or restore can each produce a different clock start and stop, so two teams quoting “MTTR” may be measuring different things entirely.
- Repair: the time to fix the underlying technical fault, which can end before users notice restoration.
- Recover: the time until the service is functioning again for users, regardless of whether the root cause is fixed.
- Resolve/restore: the time until the incident is fully closed, including verification and cleanup.
Say an outage starts at 2:00 PM. The faulty code is patched at 2:40 PM, but the service only stabilizes for users at 2:55 PM, and the team marks the incident closed at 3:15 PM after monitoring confirms it held. That’s a 40 minute repair time, a 55 minute recovery time and a 75 minute resolution time, all from the same incident. Pick the reading that matches what your SLOs actually protect, usually recovery, and write down your start and end rules so every engineer measures the same thing.
How to Calculate MTTR: Formula, Timestamps and Scoping
The standard formula is simple: total incident duration divided by the number of incidents in the period. The arithmetic is trivial. The timestamps are where teams get it wrong.
- Incident start: the moment the failure began affecting users or systems, not when someone noticed it.
- Remediation complete: the moment the fix or mitigation was applied.
- User-visible restoration: the moment monitoring or customers confirm normal service, which is the timestamp most recovery-reading MTTR calculations should use.
A worked example: three incidents last 20, 45, and 100 minutes. Total duration is 165 minutes across three incidents, for an MTTR of 55 minutes. That single number hides the real story, since one 100 minute severity-1 event is dragging the average up while two shorter incidents look routine.
Scope by severity before you average. Blending a severity-1 database outage with a severity-3 cosmetic bug produces an MTTR that describes neither well. Report MTTR per severity tier, and treat the all-incidents average as a summary stat at best.

Breaking MTTR Into Detection, Diagnosis, Repair and Validation
Under a recovery-reading MTTR, the clock includes everything from first impact to restored service, which means detection and acknowledgment time are baked in. Splitting the timeline into segments shows you where the minutes actually go.
- Detect (MTTD): time from failure to alert firing, driven by monitoring coverage and check frequency.
- Acknowledge (MTTA): time from alert to a human engaging, driven by paging hygiene and on-call clarity.
- Diagnose: time to find the cause, usually the largest and most variable segment because it depends on available context, not just effort.
- Repair and validate: applying the fix and confirming it held, often fast once diagnosis is done.
Detection improves with symptom-based alerts and multi-location checks. Diagnosis improves with better traces, logs and request-level context. Repair improves with runbooks and automation. Each segment needs a different kind of investment, so measure them separately before deciding where to spend effort.
What DORA’s Benchmarks Say About Good Recovery Time
DORA’s 2022 Accelerate report groups teams into performance cohorts for time to restore service: elite performers typically restore in under one hour, high performers in under a day, medium performers around a day, and low performers anywhere from a week to a month.

Elite teams restore service in under an hour, according to DORA’s research, a gap wide enough that climbing even one cohort meaningfully changes user-facing downtime.
Treat these cohorts as a starting point, not a universal target. A payments API and an internal reporting dashboard should not share an MTTR goal, since criticality and incident mix change what “good” means for your service. Translate the cohort you’re aiming for into an SLO and let your error budget absorb the incidents that push past it, rather than chasing a single number in isolation.
Tactics That Actually Shrink Recovery Time
Most MTTR reduction work falls into a few categories, and the order matters: fix detection and diagnosis before you polish repair speed, since those two segments usually hold the larger share of total recovery time.
- Alert on symptoms, not causes. End-to-end checks that mimic real user paths catch outages faster than resource-level alerts and reduce detection time directly.
- Capture failing request state immediately. Traces, logs and session data gathered at the moment of failure remove the need to reproduce the problem later, which is often the single biggest diagnosis time saver.
- Write runbooks for known failure modes and pre-authorize the fix. A documented, approved mitigation turns a judgment call into a checklist item.
- Automate repeatable remediations. Restarts, failovers and cache clears that follow a known pattern don’t need a human in the loop every time.
- Ship small and keep rollbacks cheap. Feature flags and small-batch deploys make it fast to back out a bad change, and DORA’s own analysis ties smaller, more frequent changes to faster failed-deployment recovery because they’re easier to diagnose and reverse.
- Run game days. Scheduled failure drills surface the runbook gaps and missing telemetry that real incidents expose at the worst possible time.
Pro Tip: Audit your last ten incidents by segment (detect, acknowledge, diagnose, repair) before investing in any single fix. Whichever segment has the widest spread across incidents is usually your best next investment.
For teams building out alert routing as part of this work, a closer look at notification architecture covering batching, delivery guarantees and suppression is worth a read, since paging hygiene directly affects MTTA.
Incident Roles, Postmortems and Measurement Hygiene
Low MTTR doesn’t stay low by accident. It holds up because the organization around it is consistent.
- Preassign incident roles. An incident commander, scribe and communications lead chosen before the incident removes the coordination lag that otherwise eats the first several minutes of a response.
- Run blameless postmortems. Google’s SRE guidance treats post-incident review as the primary lever for reducing future MTTR, since it surfaces the telemetry and coordination gaps that made diagnosis slow.
- Turn findings into prioritized action items tied to SLOs, not a list of vague intentions that nobody owns.
- Keep timestamping and severity scoping consistent, and split MTTR by incident type so trends mean something instead of averaging unlike events together.
How Monitoring Design and AI Assistants Cut Diagnosis Time
Monitoring that pages on every blip trains engineers to ignore alerts, which quietly inflates MTTA across the board. Confirming a failure from a second location before opening an incident is one way to cut that noise without missing real outages.
- Multi-location confirmation: an incident opens only after repeated failures confirmed from a second region, which cuts the false pages that cause alert fatigue.
- MCP-connected AI assistants: available on every Uptime Beacon plan including Free, tools like Claude, ChatGPT, Cursor or VS Code can connect to our MCP server, read monitor and incident history, and help narrow down which region or check is failing, with authorized teams able to let the assistant acknowledge incidents or start maintenance windows.
- Heartbeat monitoring, certificate and domain expiry checks, and status pages that run independently of the dashboard round out the detection side of MTTR.
- EU-based control plane and database for teams with data residency requirements.
Why False Alarms Distort Your MTTR Numbers
A false alarm, where monitoring flags an outage that never really affected users, does two kinds of damage to MTTR. First, it adds noise to the metric itself: an “incident” that resolves in 90 seconds because nothing was actually wrong drags your average down and makes the number look better than your real recovery performance. Second, and more costly, repeated false alarms train on-call engineers to hesitate before responding, which slows acknowledgment time on the incidents that are real.
The fix is architectural, not procedural. Checking from a single location means a transient network blip between the monitor and your server looks identical to a real outage, so every noisy network path becomes a page. Confirming failures from a second, independent region before opening an incident filters out that category of noise entirely, since a real outage affects checks from multiple regions while a routing hiccup usually doesn’t. Requiring several consecutive failed checks, rather than acting on the first one, adds a similar filter against momentary blips.
Minimizing false alarms isn’t about fewer alerts for their own sake. It’s about making sure every incident that opens is one worth measuring, so your MTTR reflects actual recovery work rather than monitoring artifacts. Review your false-positive rate periodically, and if a particular check or region keeps triggering alerts that resolve themselves, that’s a signal to adjust the check logic or increase the confirmation threshold, not to dismiss the alert.
A Practitioner’s View on Chasing the MTTR Number
MTTR is a tool, not a trophy. A team that drives recovery time down while leaving detection blind spots in place has optimized the wrong half of the timeline. Once repair and diagnosis are tight, the next gains usually come from catching problems earlier, not responding faster. Let postmortems and SLOs decide where the next hour of reliability work actually goes.
— Aaditya Parashar
A Monitoring Setup Built Around Fewer False Pages
We built Uptime Beacon around the problem described above: monitoring that pages you for real outages and stays quiet for everything else. An incident opens only after repeated failures confirmed from a second region, so a single flaky network path doesn’t wake up your on-call engineer.
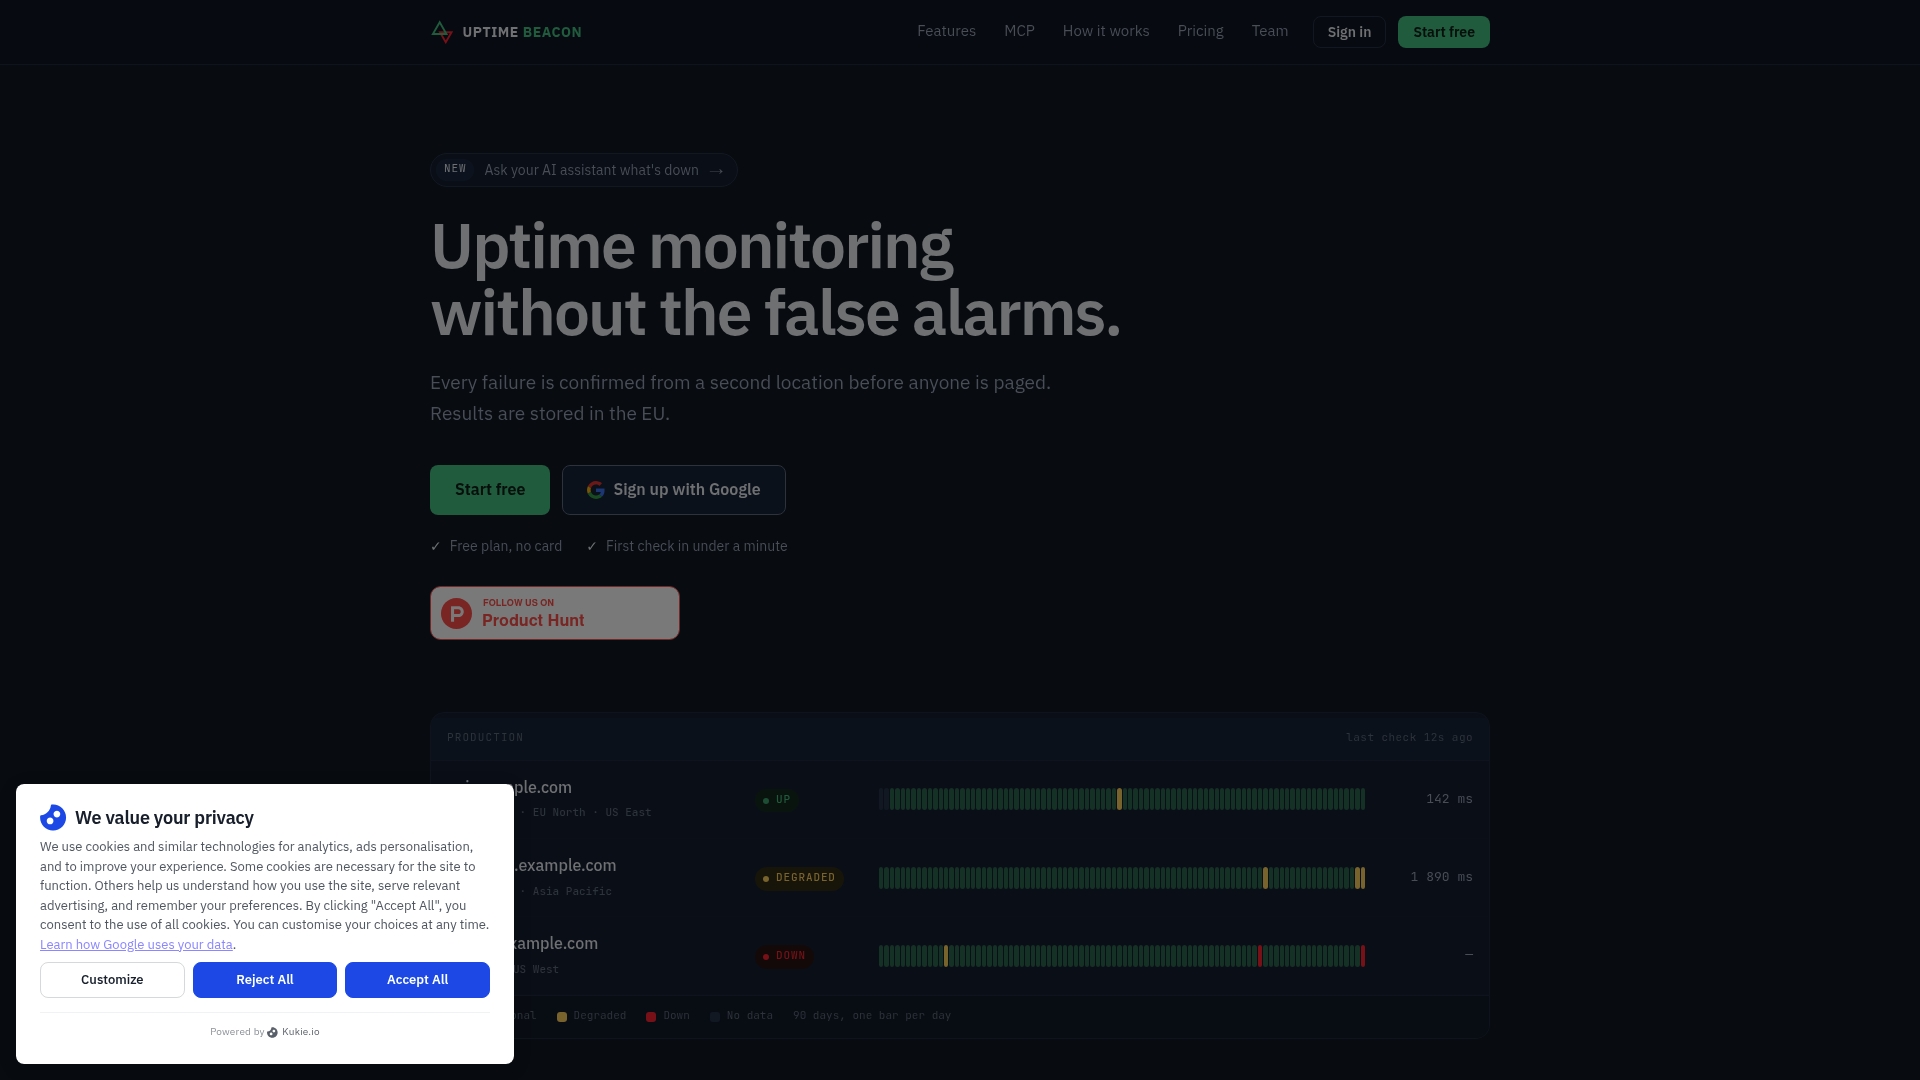
- Multi-region checks from EU Central, EU North, US East, US West and Asia Pacific confirm failures before alerting.
- AI assistants over MCP on every plan, Free included, connect Claude, ChatGPT, Cursor or VS Code to your monitors and incident history for faster diagnosis.
- Status pages run independently of our dashboard, so they stay reachable during an incident.
- EU data residency for every stored result, for teams that need it.
Start on the Free plan, no card required, with 5 monitors checked every 5 minutes from EU Central and one alert channel. Paid plans start at Starter for 14.99 EUR per month if you need more monitors, multi-location confirmation or maintenance windows.
FAQ
What does MTTR stand for in incident management?
MTTR most often stands for mean time to recovery, the average time from when an incident starts until service is restored for users. The same acronym is also used for mean time to repair, resolve or restore, so teams should confirm which reading a given report uses.
How do I calculate MTBF?
Mean time between failures is calculated as total operational time divided by the number of failures in that period, measuring how often incidents occur rather than how fast you recover from them. It’s a separate metric from MTTR, and the two are usually read together to understand both frequency and recovery speed.
How can I improve my MTTR?
The fastest gains usually come from symptom-based alerting to cut detection time and capturing failing request context like traces and logs to cut diagnosis time, since diagnosis tends to be the most variable segment of recovery. Runbooks, pre-authorized mitigations and small-batch deploys with easy rollbacks round out the highest-impact changes.
What is considered a good MTBF value?
A good MTBF value depends entirely on the system and industry, since a payment gateway and a batch reporting job have very different failure tolerances. Rather than aiming for a universal number, compare your MTBF trend over time and against your own service’s SLO requirements.
How does MTTR relate to MTTD and MTTA?
Under a recovery-reading MTTR, detection time (MTTD) and acknowledgment time (MTTA) are both included inside the total recovery clock, so improving either one directly lowers MTTR. Teams that have already optimized repair speed often find that cutting detection time yields the larger remaining gains.
Sources
- Rootly glossary — MTTR
- 2022 Accelerate State of DevOps Report — DORA
- What’s MTTR? Mean Time to Repair: Definitions, Tips, & Challenges | Splunk
- Google SRE — Emergency response


