An API health check is a small endpoint, usually GET /health, that answers one question: can this service do its job right now? Good ones separate “the process is alive” from “it can serve traffic”, stay cheap to call, reveal nothing to attackers, and get probed from outside your network so you hear about failures your own infrastructure can’t see. This guide covers all four, with concrete patterns you can copy.
TL;DR
- Expose two endpoints: a shallow liveness check (is the process responsive?) and a deeper readiness check (can it reach its dependencies?). Never run deep checks on every probe.
- Keep responses small, return honest status codes, and leave stack traces, versions and internals out of public responses.
- Probe from outside your infrastructure, from more than one region, and alert only after repeated failures.
- A health endpoint tells you what the service thinks. Pair it with an external check that tells you what users experience.
Table of Contents
- What a health check endpoint should answer
- Liveness versus readiness: two endpoints, two jobs
- Designing the response
- Keeping health endpoints safe
- Don’t let the health check become the outage
- What to check inside a deep check
- Why an internal health check isn’t enough
- A setup that works for a typical API
- Common mistakes
- Our perspective
- Monitoring your health endpoints with Uptime Beacon
- FAQ
- Sources
What a health check endpoint should answer
A health endpoint exists so a machine can decide something: a load balancer deciding whether to route traffic, an orchestrator deciding whether to restart a container, or a monitoring service deciding whether to wake someone up. Each of those consumers asks a slightly different question, and that is where most designs go wrong.
The Azure Architecture Center describes the pattern as functional checks exposed by the application, which external tools call at regular intervals to verify that the app and its dependencies can serve requests. The AWS Builders’ Library frames it the same way: load balancers ask each server periodically whether it is capable of performing work, and use the answer to decide where traffic is safe to send.
So before you write a line of code, decide who is asking. An orchestrator that restarts containers needs a very different answer from a pager that wakes a human.
Liveness versus readiness: two endpoints, two jobs
The single most useful rule in health check design is to stop treating “alive” and “ready” as the same thing.
| Liveness | Readiness | |
|---|---|---|
| Question | Is the process running and responsive? | Can it serve requests right now? |
| Typical path | /livez or /healthz |
/readyz |
| Touches dependencies | No | Yes: database, cache, queue |
| Cost per call | Near zero | Higher, so call it less often or cache it |
| Consumer’s action on failure | Restart the process | Stop routing traffic to it |
Microsoft’s guidance is that shallow liveness probes should only verify that the process is responsive, while deep readiness probes verify the dependencies needed to serve requests, such as database connectivity. The reason is practical. If your liveness probe queries the database and the database slows down, every instance of your API fails liveness at once, the orchestrator restarts all of them, and a database problem becomes a full outage.
Kubernetes bakes the same split in. Its docs describe liveness, readiness and startup probes as separate mechanisms, and note that an application that needs to load large data at startup should not be killed, but should not receive requests either. That is the readiness case exactly.
The zombie instance problem
There is a quieter failure on the other side. If your health check returns 200 as soon as the web server binds a port, a new instance can enter the load balancer rotation before it has finished warming caches or running migrations. Render’s health check guidance recommends a dedicated path such as /health or /healthz, a small body, and no heavy work on each request. Tie readiness to real ability to process requests, not to the process merely existing.
Designing the response
Status codes first
Most consumers read only the status code, so make it honest. For HTTP probes, Kubernetes treats any code from 200 to 399 as success and everything else, including a connection failure, as failure. Return 200 when healthy and 503 when the service cannot take traffic. Avoid returning 200 with {"status":"error"} in the body: a probe that only checks the code will call that healthy.
A standard body, if you want one
A plain 200 with an empty or tiny body is enough for most services. If you want structure, the IETF draft for health check responses defines a application/health+json format. Per the draft, the status field is pass, fail or warn, with optional fields such as version, releaseId, notes and a checks object for sub-components. It is a draft, not a ratified standard, but it gives you a predictable shape instead of inventing your own.
A minimal example:
{
  "status": "pass"
}
And a readiness response for an internal consumer:
{
  "status": "warn",
  "checks": {
    "database": [{ "status": "pass" }],
    "cache": [{ "status": "warn" }]
  }
}
The second example is useful to your own team. It is not something to expose to the whole internet, which brings us to security.
Keeping health endpoints safe
Health endpoints are easy to find and tempting to overfill. The OWASP API Security Top 10 entry on security misconfiguration calls out missing TLS and error responses that leak details such as stack traces as ways to help an attacker compromise a server. A readiness response that lists your database host, version numbers and the state of every internal component is reconnaissance handed over for free.
A practical split:
- Public endpoint: returns only the status code and, at most, a minimal
passorfail. No version strings, no dependency names, no error text. - Detailed endpoint: returns the per-component breakdown, and sits behind authentication or a network restriction such as an internal-only listener.
- TLS everywhere: the probe should reach you over HTTPS like any other API traffic.
- Least privilege: if the probe needs a token, give it the minimum permissions. A 200 from a health check says nothing about whether a caller is authorized for anything else.
AWS’s DevOps guidance notes that a health check endpoint is usually best kept secure and private for internal use. If an external monitor must reach it, that is a good reason to keep the public one deliberately boring.
Don’t let the health check become the outage
A health check consumes the same CPU, memory and connections as real traffic. The Azure pattern guidance warns that excessive probe frequency can degrade production performance, and suggests caching status results periodically as one way to balance detection delay against overhead.
Three habits keep this under control:
- Cache the deep check. Run the database and cache pings on a timer every few seconds and have the endpoint return the last result, rather than opening a connection per request.
- Set timeouts on every dependency call. A deep check without a timeout turns a slow dependency into a hung probe, and hung probes pile up. Azure’s guidance is that deep checks need timeouts to avoid cascading failures.
- Rate-limit the endpoint. AWS’s engineers recommend precautions around the probe itself, including rate limiting, thresholding so transient blips do not trigger reactions, and circuit breakers so an unhealthy dependency doesn’t take down healthy instances.
That last source also makes a point worth underlining: the best health models combine probe results with logs and metrics, so you alert on user-facing problems and not just on one failed probe.
What to check inside a deep check
Deep checks are tempting to write exhaustively. Resist that. Check what the service cannot work without, and nothing more.
- Primary datastore: a trivial query, with a short timeout.
- Hard dependencies: a queue or cache your request path cannot survive without.
- Not on the list: third-party APIs you can degrade around, and anything slow. If a payment provider is down but your catalog still works, failing readiness would pull healthy instances out of rotation for no reason.
For microservices, the health check API pattern describes the handler as performing checks such as the status of connections to the infrastructure services the service uses. The same caution applies: each connection you test is a connection you can fail on.
Why an internal health check isn’t enough
Your liveness and readiness endpoints answer to your orchestrator. They run inside your network, from the same place as your service. They cannot tell you that DNS is broken, that a certificate expired, that your CDN is misrouting a region, or that the load balancer itself is down. For those you need an outside observer calling your public endpoint the way a customer’s client would.
That external probe should do three things well.
Probe from more than one location
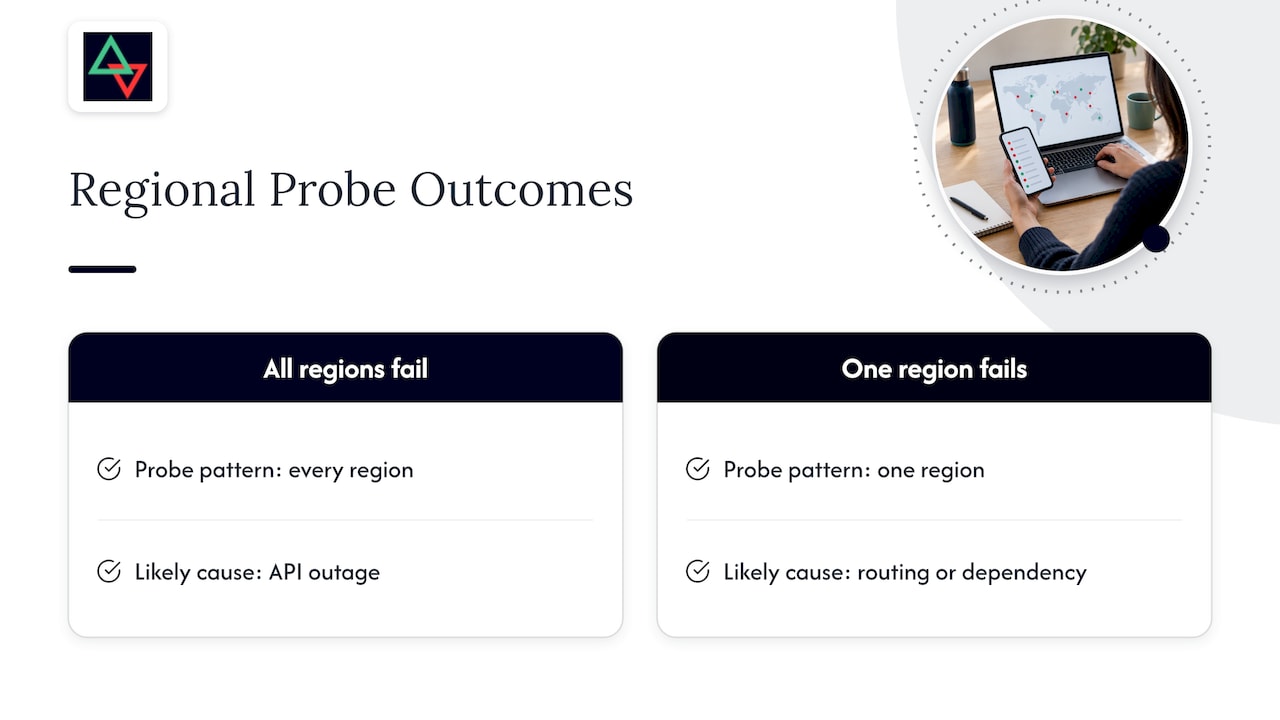
One probe location gives you one network path. When it fails you can’t tell whether your API is down or that path is. Checking from several regions lets you read the pattern: failing everywhere points at you, failing from one region points at routing or a regional dependency.
Require repeated failures
The internet drops packets. A single failed request is rarely an incident. The AWS guidance above names thresholding as a defense against reacting to transient network blips, and it applies equally to the alerting layer. Requiring several failures in a row before opening an incident is the difference between a pager that means something and one everyone mutes.
Confirm before you page
The stronger version is confirming the failure from a second location before a human is woken. We cover the reasoning in our piece on SaaS uptime monitoring that pages only for real failures.
A setup that works for a typical API
Here is a layout we’d suggest for a small team running one API behind a load balancer.
/livez: returns 200 if the process can respond. No dependencies. Wired to the orchestrator’s liveness probe./readyz: checks the database and cache with short timeouts, caching the result for a few seconds. Wired to the orchestrator’s readiness probe and the load balancer./health(public): returns 200 or 503 with a minimal body. This is what your external monitor calls. It can reflect the same cached result as readiness, but reveals nothing about components.- External monitor: an HTTP check on
/healthfrom several regions, opening an incident only after consecutive failures confirmed from a second location. - Heartbeats for background work: workers and cron jobs don’t expose endpoints, so have them ping a heartbeat URL when they finish. A missing ping is the alert. See our guide to cron job monitoring.
- Certificate and domain watches: an API with a healthy endpoint still dies when its certificate lapses. Track certificate expiry and domain expiry separately from endpoint health.
Choosing check intervals
Interval is a trade between detection delay and load. A health endpoint that is cheap (cached, no dependency calls) can be probed often. A deep one should be probed less. With multiple regions each probing independently, the combined request rate is higher than any single interval suggests, so account for that when you decide how much work the endpoint does.
Common mistakes
- Always returning 200. A hardcoded OK tells you the web server is running and nothing else.
- Deep checks in liveness. One slow database restarts your whole fleet.
- Leaking internals. Stack traces, version numbers and hostnames in a public response help the wrong people.
- Authentication on the monitoring path with a long-lived admin token. Use the narrowest credential possible, or no credential on a deliberately minimal endpoint.
- Alerting on a single failure. Thresholds and confirmation exist because networks are noisy.
- Monitoring only the health route. A healthy
/healthwith a broken/ordersis a common outage shape. Also monitor one or two representative endpoints that exercise real logic.
Our perspective
We built Uptime Beacon after decades of being on the receiving end of bad alerts. Our founders have 30+ years combined running production in banking, fintech, telecom and SaaS, and the lesson that stuck is that most pages are about the monitor, not the service. A health check that flaps, a probe from one region over a congested path, a single timeout treated as an outage: each trains the on-call engineer to distrust the pager.
So our view of API health checks has two halves. Inside your service, keep the endpoint honest and cheap and split liveness from readiness. Outside it, treat a failed probe as a question, not a verdict: wait for several failures in a row, and on paid plans have a second location confirm before an incident opens. When the pager does ring, it should be right.
We also think the diagnosis step is where tooling should help most. Over MCP, an assistant such as Claude, ChatGPT, Cursor or VS Code can read your monitors, incidents and check history and compare a failing monitor region by region, which is exactly the first question you ask at 3 a.m. That works on every plan, Free included, and nothing can be deleted over MCP.
— Aaditya Parashar
Monitoring your health endpoints with Uptime Beacon
Uptime Beacon checks HTTP endpoints, TCP ports and hosts from five regions: EU Central, EU North, US East, US West and Asia Pacific. Incidents open only after several failures in a row, and paid plans add confirmation from a second location. Alerts go out by email or Slack, and public status pages don’t depend on the dashboard, so they stay reachable during an incident.
The Free plan costs 0 EUR per month with no card: 5 monitors every 5 minutes from EU Central, one alert channel (email or Slack) and one status page. Paid plans are Starter at 14.99 EUR per month, Pro at 39.99 EUR per month and Business at 89.99 EUR per month, and Enterprise has no published price. Extra monitors are available as add-ons: 10 more on Starter for 5 EUR per month, 50 more on Pro for 10 EUR per month, and 100 more on Business for 15 EUR per month. All results are stored on a control plane and database in the EU.
You can start on the Free plan and compare the paid tiers, or read how API and cron monitoring for SaaS teams fits together. If you manage many client sites, see monitoring for agencies. After an incident, mean time to recovery is worth reading before you decide what to measure.

FAQ
What is the best URL for a health check endpoint?
There is no official standard path, but /health, /healthz, /livez and /readyz are common conventions, and Render’s guidance recommends a dedicated path such as /health or /healthz. Pick one, document it, and keep it separate from business routes. Use distinct paths for liveness and readiness.
Should a health check test the database?
Only in the readiness check, never in liveness. Use a trivial query with a short timeout, and cache the result for a few seconds so probes don’t open a new connection each time. This keeps the check useful without letting it add load to a struggling database.
How often should I probe a health endpoint?
As often as the endpoint is cheap, and no more. A shallow, cached endpoint tolerates frequent probes, while a deep one should be probed less often. Remember that probes from several regions add up, and that Azure’s guidance warns excessive probe frequency can hurt production performance.
Is it safe to expose a health endpoint publicly?
Yes, if it is minimal. Return a status code and little else, serve it over TLS, and keep detailed component data on an authenticated or internal-only endpoint. OWASP flags stack traces in error responses and missing TLS as misconfigurations that help attackers.
Does a passing health check mean my API is up for users?
Not necessarily. It means the service believes it is healthy from where it sits. DNS, certificates, CDN routing and load balancer faults are invisible from inside, so monitor the public endpoint from outside, from multiple regions, and alert only on confirmed, repeated failures.
Sources
- Health Endpoint Monitoring Pattern, Azure Architecture Center
- Implementing health checks, AWS Builders’ Library
- Build health checks into every service, AWS DevOps Guidance
- Configure Liveness, Readiness and Startup Probes, Kubernetes
- Kubernetes Liveness Probe: Tutorial & Examples, Apptio
- Health check patterns, Render skills reference
- draft-inadarei-api-health-check, IETF
- API8:2023 Security Misconfiguration, OWASP API Security Top 10
- Pattern: Health Check API, microservices.io


