The fastest way to reduce alert noise is to page a human only for conditions that are urgent, actionable and user-visible, and to require proof before an alert fires. That means confirming failures over several checks, confirming them from a second location, collapsing duplicates, routing by severity, and then measuring whether the pager got quieter without getting blind. This guide walks through each step in the order we would do it, with the trade-offs.
TL;DR
- Page on symptoms users can feel, not on every internal cause. Everything else goes to a ticket or a dashboard.
- Require a failure to persist across several consecutive checks and be confirmed from a second region before an incident opens. Most network blips die in that gap.
- Deduplicate, group and inhibit so one outage produces one page, not forty.
- Review alerts on a schedule and track actionable-alert rate, false-positive rate and duplicates. If you cannot measure it, you have not fixed it.
- Every tuning change needs a way back. Quieter is only better if real incidents still get through.
Table of Contents
- Why noisy alerts are an outage risk, not an annoyance
- Stop paging on a single failed check
- How Uptime Beacon applies this by default
- Page on symptoms, ticket on causes
- Use SLOs to decide how much failure is too much
- Collapse duplicates before they reach a person
- Route by severity, schedule and ownership
- Make alert review a habit, not a cleanup project
- Allow-lists and suppressions need an expiry date
- Measure whether it worked
- Our perspective: confirm first, then wake someone
- Try a quieter setup on the Free plan
- A practical order of operations
- FAQ
- Sources
Why noisy alerts are an outage risk, not an annoyance
A noisy pager does not just cost sleep. It teaches people to doubt it. Google’s SRE guidance says pages should be about urgent, actionable conditions that are actively or imminently user-visible, and notes that frequent pages lead people to second-guess, skim or ignore alerts. The same chapter argues that every page should be about a novel problem, not something you have already seen and know how to dismiss.
That is the real cost. When nine of ten pages are blips, the tenth one gets a slower, more skeptical response. Teams then call it “alert fatigue” and reach for more tooling, when the first fix is usually simpler: stop creating alerts that nobody can act on.
There are three common sources of noise, and they need different cures:
- False positives. The alert fired but nothing was wrong for users: a dropped packet, a slow route between one probe and your server, a deploy that restarted a process for four seconds.
- Duplicates. One real problem triggers many alerts: the database is down, so every service that depends on it pages separately.
- Non-actionable alerts. The condition is real but nobody needs to do anything right now: CPU at 82% overnight, a disk that will fill in three weeks.
The rest of this article goes in that order, starting with the one our product is built around.
Stop paging on a single failed check
The most common source of false alarms in uptime monitoring is also the easiest to remove: treating one failed request as an outage. A single check can fail because of a transient network problem between the probe and your server, a DNS hiccup, or a TCP reset in the middle. None of those mean your users are down.
Google’s SRE book describes the same principle for alerting rules: you can require a condition to hold for a minimum duration, typically at least two rule evaluation cycles, which guards against a missed collection triggering a page. Two independent failures in a row are far less likely to be noise than one.
There are two dials here:
- Consecutive failures. How many checks in a row must fail before you open an incident. More failures mean fewer false alarms and a later page.
- Confirmation from elsewhere. Whether a different location sees the same failure. If your server is reachable from Frankfurt but not from one probe, the problem is probably the path, not you.
The delay is the price, so spend it deliberately
Every confirmation step delays the page. With checks every five minutes, three consecutive failures means you learn about an outage roughly ten to fifteen minutes after it begins. That may be fine for a marketing site and unacceptable for a checkout API. Pick the number per service, based on what a minute of downtime costs, not as a global default.
A reasonable starting point:
| Service type | Failures in a row before paging | Second-location confirmation |
|---|---|---|
| Checkout, login, payment API | Fewer, with the fastest check interval you have | Yes |
| Public marketing site | A few | Yes |
| Internal tools, staging | Many, or ticket instead of page | Optional |
| Cron jobs and workers | Based on missed heartbeats, not response time | Not applicable |
The exact counts depend on your check interval, so treat the table as a shape, not a prescription. Write the number down next to each monitor and the reason for it.
How Uptime Beacon applies this by default
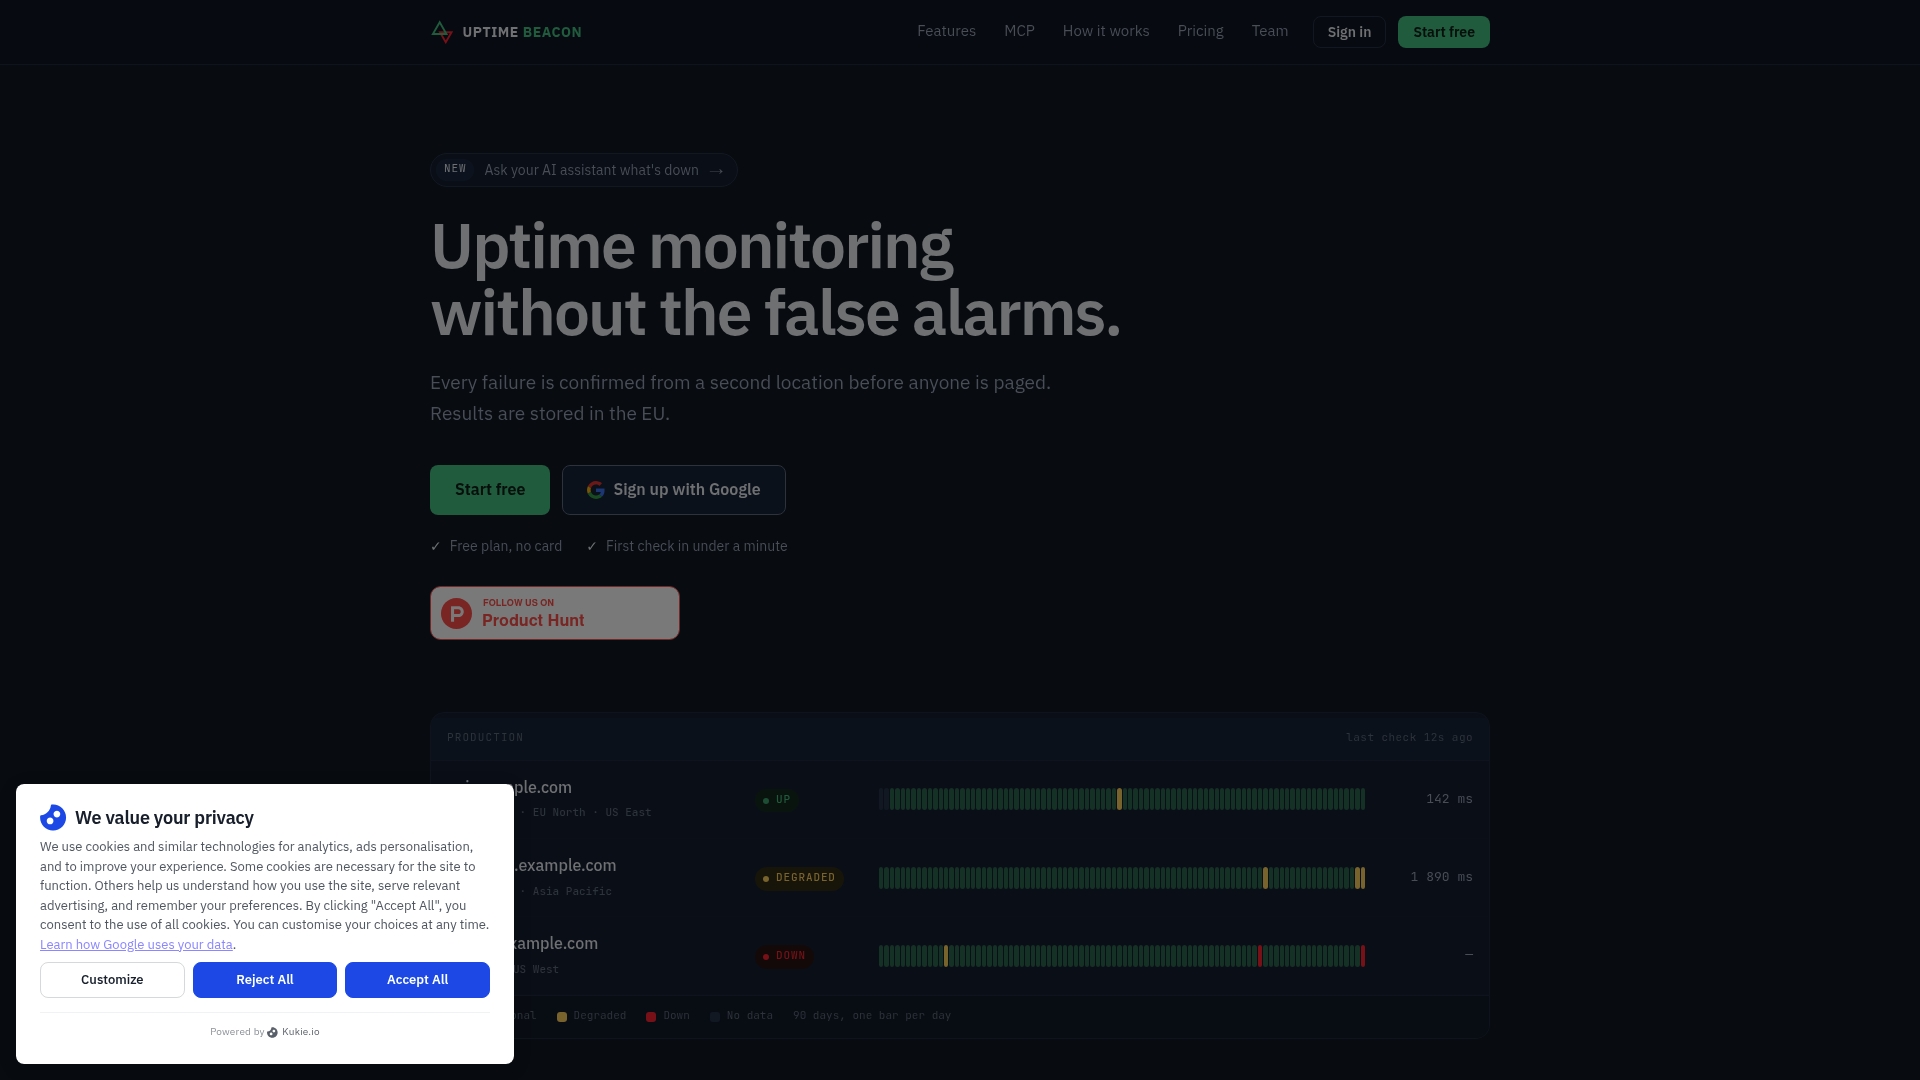
We built Uptime Beacon around this exact problem. An incident opens only after several failures in a row, and on paid plans a second location must confirm the failure before anyone is paged. Checks run from five regions: EU Central, EU North, US East, US West and Asia Pacific. If one region sees a failure and the others do not, you do not get a 3 a.m. call for a network blip.

The Free plan includes 5 monitors checked every 5 minutes from EU Central, one alert channel (email or Slack) and one status page, with no card. Second-location confirmation is part of the paid plans. For a closer look at how that confirmation plays out in an incident, see our write-up on confirming failures at two locations.
Page on symptoms, ticket on causes
The second big lever is deciding what deserves a human at all. Google’s SRE guidance is to focus paging on symptoms rather than causes: users cannot log in, requests are failing, latency is past what you promised. High memory on a host is a cause, and it might never become a symptom.
A quick filter you can apply to any alert in your system:
- Is a user, or a customer promise, affected now or soon? If not, it is not a page.
- Is there something a human can do about it right now? If the answer is “wait,” it is not a page.
- Have we seen this exact thing before with a documented fix? If so, automate the fix or fix the root cause.
Alerts that fail the filter do not have to be deleted. Move them to a lower-urgency channel: a Slack message, an email digest, a ticket. The AWS Well-Architected DevOps guidance makes the same point: tune alert rules and thresholds to business impact and severity and keep refining them from usage patterns.
For API-heavy services, the symptom is often not just “the port is open” but “the response is correct.” Our guide on what to check and how to alert for API uptime covers status codes, response content and where to set the line between a page and a notification.
Use SLOs to decide how much failure is too much
If you already have service level objectives, they are the best filter available. Google’s SRE workbook argues that alerting on SLOs gives the highest-quality signal of when a human should respond, because it ties paging to customer experience instead of to a raw metric.
The idea in plain terms: instead of paging when a single error spike occurs, page when you are burning through your error budget fast enough to threaten the objective. A brief spike that consumes a sliver of budget goes to a ticket. A sustained failure that would exhaust the month’s budget in hours pages someone.
An engineering team at Macquarie reported that moving from hourly to weekly burn-rate calculations cut intermittent, non-significant alerts by aligning alerts with actual business impact. They also replayed alerts against historical data to confirm that significant incidents would not have been filtered out. That replay step is worth copying: before you loosen a rule, ask what it would have done during your last five real incidents.
Collapse duplicates before they reach a person
One outage should be one conversation. When a database fails and thirty dependent checks each page, the on-call engineer spends the first ten minutes silencing alerts instead of diagnosing.
The techniques are old and reliable. Google describes Alertmanager-style behavior: it can inhibit certain alerts when others are active, deduplicate alerts with the same label sets, and fan alerts in or out by label. AWS recommends deduplication, aggregation and visualization to cut ineffective alerts.
Practically, that means:
- Deduplicate by incident: a monitor that is already in a failing state should not page again every interval.
- Group related monitors under one service or one dependency so a root-cause failure produces one notification.
- Inhibit downstream alerts while an upstream one is active.
- Suppress during maintenance. Planned work is the most avoidable noise there is. Uptime Beacon supports maintenance windows on Starter and above, so deploys and migrations do not page anyone.
Be careful with correlation. The UK National Cyber Security Centre, writing about security detection, notes that combining related detections helps because an isolated alert is more likely to be a false positive, but it also warns against letting correlation make teams ignore a meaningful single detection. In monitoring terms: grouping is good, but a lone failure on a critical path still deserves a look.
Route by severity, schedule and ownership
Even well-tuned alerts are noise if they reach the wrong person. Atlassian’s documentation on routing describes sending alerts by source, content and time, using schedules to notify on-call members and escalation policies that advance to the next recipient after a set time.
A simple three-tier model works for most small teams:
| Tier | Example | Where it goes |
|---|---|---|
| Page | Production endpoint failing, confirmed from two regions | On-call engineer, immediately, escalate if not acknowledged |
| Notify | Certificate expiring in weeks, a slow-but-up endpoint | Team Slack channel or email, working hours |
| Record | Single-region blip, recovered | Incident history only, reviewed weekly |
Certificate and domain expiry are a good example of alerts that should rarely page at night. They are predictable, so warn early through a calm channel. Uptime Beacon includes certificate and domain expiry watches for exactly that purpose.
Cron jobs and background workers need their own treatment: they fail by not running, not by returning errors. Heartbeat monitoring flags a missing ping rather than a failed request, which avoids a whole class of false alarms. Our guide to cron job monitoring and two-location confirmation covers how to set grace periods so a job that runs slightly late does not wake anyone.
Make alert review a habit, not a cleanup project
Alert rules rot. Systems change, traffic grows, owners leave, and the thresholds you set a year ago no longer mean what they did. The NCSC advises reviewing detection use cases regularly, improving rule logic and cautiously removing high-false-positive alerts rather than letting stale rules persist.
monday.com’s engineering team describes a lightweight version of this: record each alert’s disposition, root cause, duplicate status and follow-up action, then review the data quarterly to prioritize fixes. You do not need a platform for that. A shared spreadsheet filled in at the end of each on-call shift works.
A workable review loop:
- At the end of each shift, the on-call engineer tags every page: actionable, duplicate, false positive or needed no action.
- Weekly, the team looks at the five noisiest alerts.
- For each one, choose exactly one treatment: raise the failure count, widen the window, add a confirmation, group it, demote it to a notification, or delete it.
- Quarterly, look at trends and retire rules nobody has acted on.
Change one thing at a time. Otherwise you cannot tell which change made the pager quieter, or which one made it blind.
Allow-lists and suppressions need an expiry date
Suppressing an alert feels free, and that is the danger. The NCSC recommends allow-lists that are narrowly scoped and time-bounded, and stresses that reducing false positives has to be balanced against the risk of hiding something real. Apply the same rule to silences and muted monitors: give each one an owner, a reason and an end date. A mute with no expiry is a monitor you have deleted without admitting it.
Keep the previous configuration available when you roll out a change. If a new threshold leads to a missed incident, you want to revert in minutes, not reconstruct the old values from memory.
Measure whether it worked
If you only feel that the pager is quieter, you will not know whether you also became less safe. Rootly’s metrics guide suggests tracking false-positive and actionable-alert rates, alert volume by service, duplicate-alert rate, acknowledgment times and SLO coverage. It defines the false-positive rate as false-positive alerts divided by evaluated alerts, and the actionable rate as alerts that required investigation, mitigation, escalation or a meaningful decision divided by total alerts. It also warns that raising thresholds blindly can create false negatives.
A starter dashboard for a small team:
| Metric | What it tells you | Direction you want |
|---|---|---|
| Pages per on-call week | Overall load | Down |
| Actionable-alert rate | Share of pages worth waking for | Up |
| False-positive rate | Share of pages that were not real | Down |
| Duplicate rate | Share of pages for an already-known problem | Down |
| Time to acknowledge | Whether people still trust the pager | Stable or down |
| Missed incidents | Outages you learned about from users | Zero |
The last row is the guardrail. If pages drop and users start reporting outages first, you tuned too far. For help turning incident data into reports your team and clients will read, see incident reporting metrics: what to track. And if you want to compare recovery speed across incidents, one outage, three different MTTRs shows how the same event can produce very different numbers depending on how you count.
Our perspective: confirm first, then wake someone
We have spent more than 30 combined years running production in banking, fintech, telecom and SaaS, and the pattern repeats across all of them: the pager gets worse not because systems are less reliable, but because every outage, near miss and bad afternoon adds another alert and none are ever removed. Nobody gets promoted for deleting alerts, so nobody does.
Our view is that the monitoring tool should do the first round of skepticism for you. A failed check is a hypothesis, not an incident. It becomes an incident when it repeats and when a second place on the internet agrees. That is why Uptime Beacon is built the way it is, and why we would rather tell you about an outage a few minutes later than wake you for a blip.

The second half of our view is about what happens after the page. When a monitor fails, the first ten minutes are usually the same questions: which regions see it, since when, what changed. That is routine work an assistant can do. Uptime Beacon exposes an MCP server on every plan, Free included. You connect Claude, ChatGPT, Cursor, VS Code, Codex or another MCP client to https://app.uptimebeacon.eu/mcp, sign in, and there is no API key to manage. The assistant can read monitors, incidents and check history, and diagnose a failing monitor region by region. If a team turns on “Allow changes,” it can also create, pause and resume monitors, acknowledge incidents and start maintenance windows. Nothing can be deleted over MCP, which is a deliberate limit. Read more in what AI for monitoring should do first.
Quiet comes from fewer, better alerts, and an assistant that can triage the ones that remain.
— Aaditya Parashar
Try a quieter setup on the Free plan
If you want to see the difference, start with the services whose alerts you ignore most. Add them as monitors, set a sensible consecutive-failure count, and compare a week of pages against what you get today. The Free plan costs €0 per month, needs no card, and includes 5 monitors, one alert channel and one status page, plus the MCP server.
Paid plans add second-location confirmation: Starter is €14.99 per month, Pro is €39.99 and Business is €89.99. Extra capacity is available as add-ons from €5 per month, for example 10 more monitors on Starter for €5 per month. Enterprise has no published price. Compare the plans on the Uptime Beacon pricing page.
If you run an API-first product, our monitoring for SaaS teams page shows how API and cron checks fit together. If you run a shop, uptime monitoring for online shops covers the checkout and catalog cases. Every result is stored on a control plane and database in the EU, which matters if your customers ask where monitoring data lives.
A practical order of operations
If you have one afternoon, do this in order:
- List your pages from the last 30 days. Tag each as actionable, duplicate, false positive or no action needed.
- Fix the biggest category first. For most small teams it is single-failure blips; require repeated failures and a second-location confirmation.
- Demote the non-actionable. Move capacity warnings, expiring certificates and slow-but-up services to Slack or email.
- Group and inhibit. Make dependent monitors quiet while their parent is failing.
- Schedule maintenance windows so planned work never pages anyone.
- Set the metrics baseline before you change anything else, and review after two weeks.
- Keep a rollback. Note the old values so you can restore them if something slips through.
If an incident does get through, a short blameless review is where you learn whether it was a tuning problem. Use a copy-paste postmortem format and ask one question every time: would our current rules have paged us early enough? For the response itself, a first-hour incident response checklist keeps the first sixty minutes structured.
FAQ
How do you reduce alert noise without missing real incidents?
Start by removing alerts nobody can act on, and add confirmation to the rest: several consecutive failures, and agreement from a second location for uptime checks. Then track missed incidents as a guardrail. If users report an outage before your pager does, you tuned too far and should restore the previous setting.
What is the difference between alert noise and alert fatigue?
Alert noise is the stream of non-actionable notifications: false positives, duplicates and low-priority warnings. Alert fatigue is the human result, where responders become slower or start ignoring pages because so many turned out to be nothing. Reducing the noise is how you prevent the fatigue.
How many failed checks should happen before an alert fires?
There is no universal number. Google’s SRE guidance suggests requiring a condition to hold for at least two evaluation cycles as a minimum, and critical services may justify exactly that to keep detection fast. Less critical services can tolerate more confirmations. Choose per service based on the cost of a minute of downtime.
Does reducing false alerts make monitoring less safe?
It can if you do it blindly. Raising thresholds without evidence can create false negatives, so change one rule at a time, replay it against past incidents when you can, and keep the old configuration so you can roll back. Done carefully, fewer false alerts make real ones easier to notice.
Can an AI assistant help with noisy alerts?
It can speed up the triage of the alerts that remain. With Uptime Beacon’s MCP server, an assistant can read your monitors, incidents and check history and diagnose a failing monitor region by region. It cannot delete anything, and it can only change things if your team has turned on “Allow changes.”
Sources
- Google SRE Book: Monitoring Distributed Systems
- Google SRE Book: Practical Alerting from Time-Series Data
- Google SRE Workbook: Alerting on SLOs
- AWS Well-Architected DevOps Guidance: Optimize alerts to prevent fatigue
- UK NCSC: Detection practices for a Security Operations Centre
- Atlassian: What are routing rules?
- Macquarie Engineering: Data-driven alert tuning
- monday.com Engineering: Less Noise, Better Sleep
- Rootly: Alert management metrics


