A reliable way to catch cron job failures is to combine heartbeat pings with confirmatory checks, then route verified incidents to on-call alerts. Cron job monitoring means tracking whether scheduled tasks actually ran, finished, and succeeded, not just whether the scheduler fired. Without a confirmation step, monitoring can generate false alarms.
TL;DR:
- For existing jobs, send a unique, secret HTTP heartbeat only after successful completion; retain the exit code in centralized logs if the network request fails.
- Set a grace period around normal timing variation, alert after repeated missed pings, and test deliberate failures end to end before production.
- Use email for informational notices, Slack for team warnings, and PagerDuty or a webhook for urgent incidents; group related failures and confirm before paging.
- For a single host, heartbeats may suffice; fleets gain scheduler status, while Kubernetes retains only three successful and one failed job by default.
- Kubernetes exposes lastScheduleTime, but startingDeadlineSeconds skips runs that miss its wait limit, so neither signal confirms that a job produced correct output.
Table of Contents
- Why cron monitoring matters and the failure modes you must catch
- Method-level comparison: heartbeats, logs, instrumentation, and scheduler-native checks
- How to route alerts, reduce noise, and escalate effectively
- Step-by-step checklist to add heartbeat monitoring to an existing cron job
- Exact knobs and gotchas for systemd timers and Kubernetes CronJobs
- Decision criteria: how to pick the right monitoring approach for your team
- An operational perspective on reducing false alarms
- How Uptime Beacon fits into a low-noise cron monitoring setup
- FAQ
- Sources
- Authoritative docs and internal resources to implement the steps above
Why cron monitoring matters and the failure modes you must catch
Scheduled tasks fail in ways that are easy to miss until they cause real damage. A job can skip a run entirely, start late enough to break a downstream dependency, hang indefinitely without exiting, or finish with exit code 0 while producing wrong output. None of these show up unless something outside the job itself is watching.
The traditional fallback, cron’s built-in mail delivery, is a common operational trap. The cron manual documents that job output is mailed by default, but most production servers run headless with no configured mail transfer agent, so those messages pile up unread or vanish. The manual also documents the -s flag to send output to syslog instead, which at least centralizes logs, but syslog alone still requires someone to go looking.
Each scheduler exposes different signals worth monitoring:
- Cron gives you exit codes and optional syslog output, nothing more unless you add it.
- systemd timers expose unit status, journal logs, and timing accuracy settings.
- Kubernetes CronJobs expose structured status fields like
lastScheduleTimeand job history, which is far richer than plain cron.
Method-level comparison: heartbeats, logs, instrumentation, and scheduler-native checks
Four approaches cover most cron monitoring needs, and they are not mutually exclusive.

Heartbeat or external ping monitoring works by having the job call out to a URL when it starts or finishes. If the ping does not arrive within an expected window, the monitoring service flags it as missed or late. This is the simplest method to add to an existing job and it works identically across cron, systemd timers, and almost any scheduler, since it does not care how the job was triggered.
Log-based detection means forwarding job output to a central place and parsing it for exit codes or error strings. This catches more detail, including partial failures that still exit cleanly, but it requires log infrastructure and someone maintaining the parsing rules.
Instrumentation adds metrics directly inside the job: duration, success count, rows processed. Combined with synthetic end-to-end tests that verify the actual business outcome, this is the most thorough option but also the most work to build and maintain.
Scheduler-native signals are built in but limited. Cron offers almost nothing beyond exit status. systemd offers unit state and journal logs. Kubernetes CronJob status fields like lastScheduleTime, documented in the CronJob reference, tell you when a job was last scheduled, but not whether its output was correct, and startingDeadlineSeconds only governs how long a missed run waits before being skipped, as described in both the CronJob and Jobs documentation.
Pro Tip: Start with a heartbeat ping on every cron job you consider important. It takes minutes to add and catches the most dangerous failure mode: silent non-execution.
How to route alerts, reduce noise, and escalate effectively
An alert that nobody can act on quickly is worse than no alert. Build the routing logic before you build the monitors.
- Match the channel to urgency: use email for informational, non-urgent events, Slack for team-visible warnings, and PagerDuty or a generic webhook for anything that needs a human awake right now.
- Deduplicate and group related failures so one broken dependency does not generate ten separate pages for ten downstream jobs.
- Require confirmation from another check before opening an incident, so a brief network blip or dropped packet is less likely to wake anyone.
- Set a short retry window and escalate when repeated missed heartbeats suggest a persistent problem.
- Include the job name, its expected schedule, the timestamp of the last successful run, and a short log snippet in every alert payload so the on-call engineer can triage without logging into five systems first.
Step-by-step checklist to add heartbeat monitoring to an existing cron job
Adding heartbeat monitoring to a job you already run is a relatively simple task for most teams.
- Decide where the ping belongs: a start-of-job ping tells you the scheduler fired, while an end-of-job ping tells you the work actually completed, which is usually the more important signal.
- Add a single HTTP request at the end of the job script that posts to a unique monitoring URL only on successful exit, and keep that URL out of version control or behind a secret so it cannot be spoofed.
- Configure the expected window: set the grace period wide enough to absorb normal variance without being so wide that an outage goes unnoticed.
- Decide how many missed pings trigger an alert. A missed ping can be a fluke; repeated misses are a stronger signal worth escalating.
- Test the full path before trusting it: deliberately break the job, confirm the missed ping is detected, check that the alert payload has the right details, and confirm it reaches the right on-call channel.
- Add a fallback for when the ping itself fails to send: capture the job’s exit code locally and forward it to centralized logs so you have a secondary record even if the network call never goes out.
Pro Tip: Run your failure simulation on a staging job first. Finding out your alert pipeline is broken during a real incident is the worst possible time to learn it.
Exact knobs and gotchas for systemd timers and Kubernetes CronJobs
Each platform has specific settings that change whether your monitoring reflects what actually happened.
- For systemd timers, systemd.timer options like
OnCalendar,AccuracySec,Persistent, andRandomizedDelaySecall affect exactly when a timer fires, which matters if your monitoring window assumes precise timing. - journalctl reads the systemd journal where unit output lands by default, and it can filter and export logs for forwarding to a central system, similar to how cron’s
-sflag sends output to syslog as documented in the cron manual page. - Kubernetes CronJob status exposes
lastScheduleTime, and the spec includesconcurrencyPolicy(Allow, Forbid, or Replace) along withsuccessfulJobsHistoryLimit, which defaults to 3, andfailedJobsHistoryLimit, which defaults to 1, so without adjusting these you may lose history before you notice a pattern. startingDeadlineSecondsis frequently misunderstood: it defines how long the controller waits to start a job that missed its scheduled time, and once that deadline passes, the execution is skipped entirely and counted as a failure rather than retried.
Decision criteria: how to pick the right monitoring approach for your team
The right setup depends on where your jobs run and how much noise your team can tolerate.
- A single host running a handful of cron jobs is well served by lightweight heartbeat pings alone, with no need for log infrastructure.
- A fleet of servers or a Kubernetes cluster benefits from combining heartbeats with scheduler-native status fields, since the extra signal is nearly free once the cluster already exposes it.
- Self-hosted log parsing scales poorly as job count grows, while external heartbeat services scale with almost no added operational cost.
- The stricter your confirmation rules (multiple consecutive misses, second-location confirmation) should be, the higher the business impact of a false alarm or a missed real incident.
- Before trusting any setup in production, confirm the alert path has been tested end to end, a runbook exists for responding to it, and it is tied into an actual on-call rotation.
An operational perspective on reducing false alarms
The biggest mistake teams make with cron monitoring is not a missing monitor, it is a monitor that pages on the first hiccup. A single failed check, especially one confirmed from only one location, is too often just a network blip. Confirmatory checks from a second location before declaring an incident cut false pages dramatically, and testing alert paths in staging before relying on them in production catches broken escalation long before an engineer finds out during a real outage. Running periodic on-call drills for cron incidents, the same way teams drill for other failure modes, keeps the whole pipeline trustworthy instead of theoretical.
— Aaditya Parashar
How Uptime Beacon fits into a low-noise cron monitoring setup
Everything above points to the same conclusion: detect fast, but confirm before you page. That is exactly how we built heartbeat monitoring for cron jobs at Uptime Beacon.
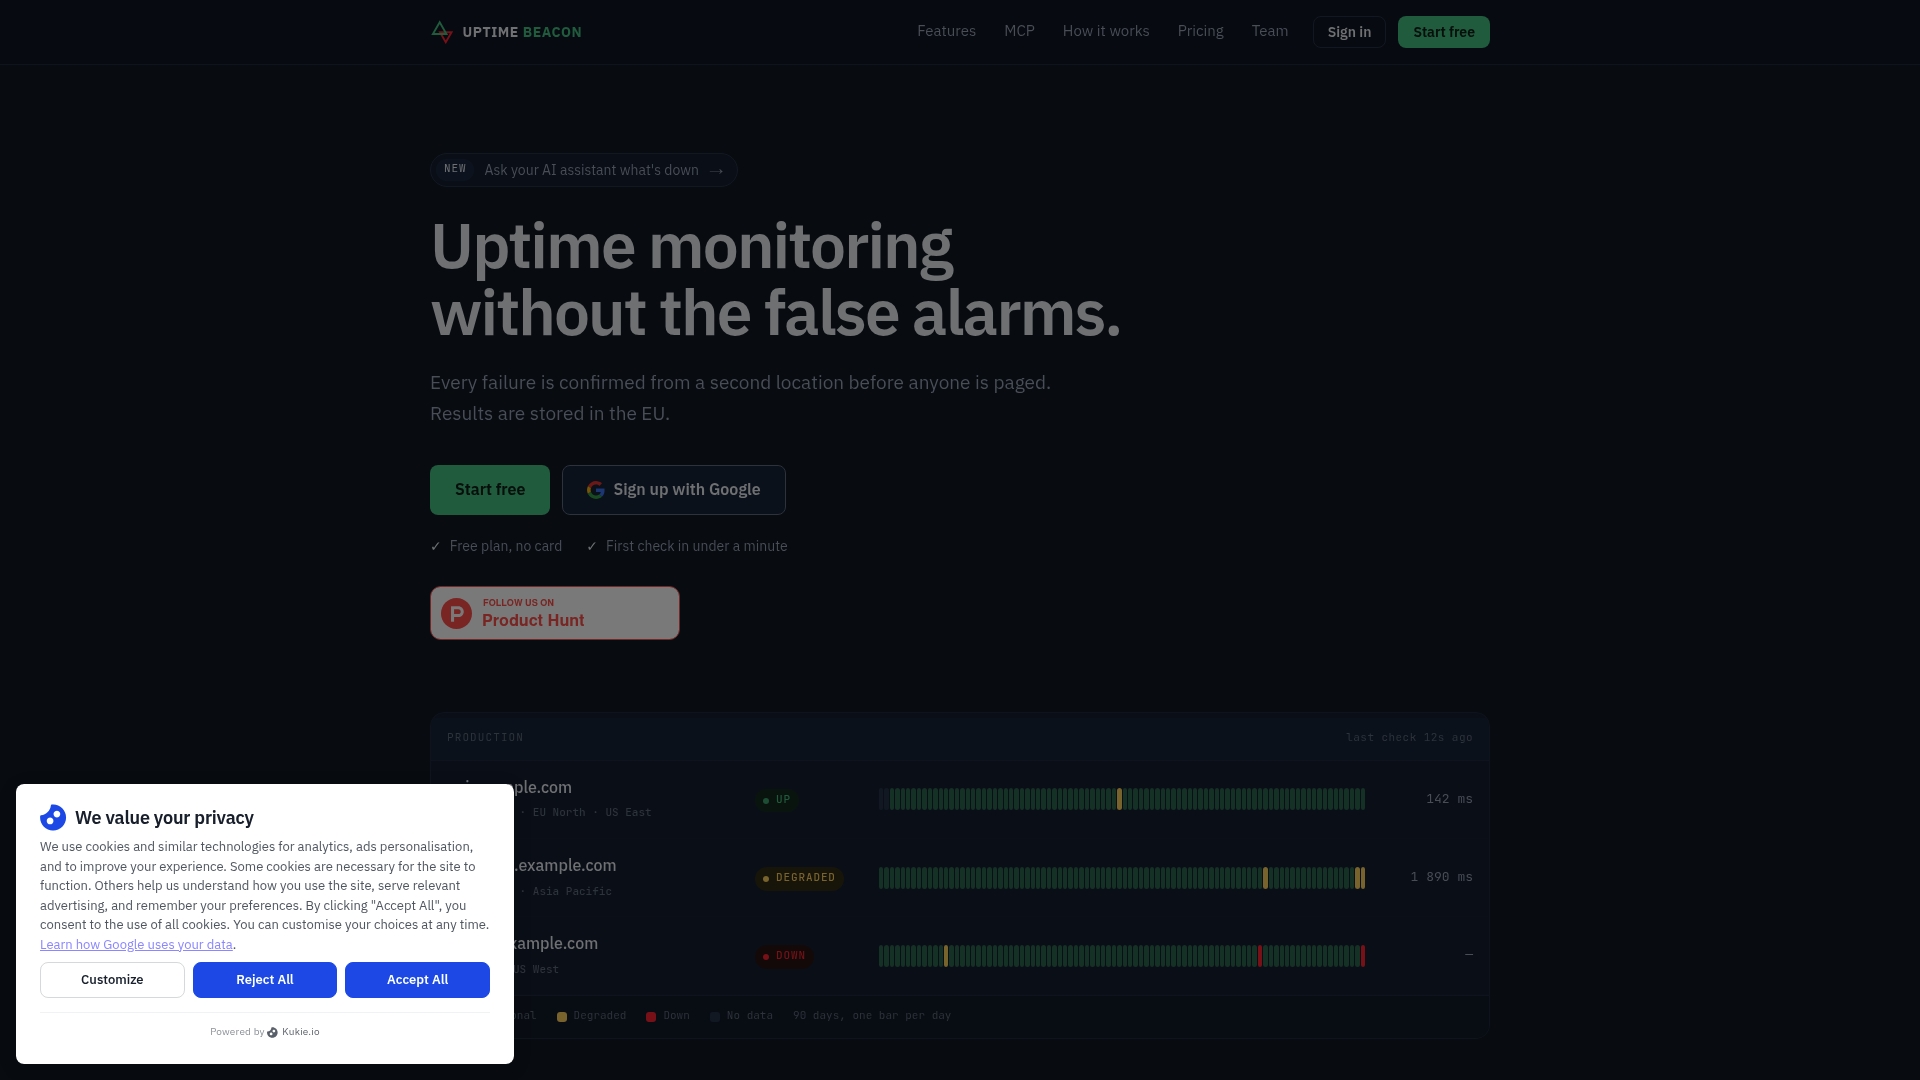
Our heartbeat monitoring is designed to catch missed, late, or hung cron jobs. For details about how incident confirmation works, see our article on certificate expiry checks.
- Heartbeat monitoring for scheduled and cron-style jobs.
- Multi-region confirmation before any incident opens, so on-call engineers aren’t woken for noise.
- An AI assistant that can help diagnose incidents.
- All monitoring data stored on infrastructure in the EU.
This fits on-call engineers and small production teams who need detection without babysitting a dashboard. Our Free plan includes monitoring and requires no card.
FAQ
Is cron outdated?
No. Cron remains widely used for simple, time-based scheduling on Linux systems, though systemd timers and Kubernetes CronJobs have added richer status and logging for larger or containerized environments. The right choice depends on your platform, not on cron being obsolete.
How do I run a cron job?
You add a line to a crontab file specifying five schedule fields (minute, hour, day of month, month, day of week) followed by the command to run, as defined in the crontab manual. Edit it with crontab -e, and the cron daemon picks up changes automatically.
Where are cron logs kept?
By default, cron mails job output to the user unless redirected, but the -s option documented in the cron manual sends output to syslog instead. On systemd-based systems, unit output typically lands in the journal, readable with journalctl.
What cron job should run every day at 8 AM?
The schedule expression for 8 AM daily is 0 8 * * * in standard crontab syntax. What job you run at that time depends entirely on your use case, such as a daily report, backup, or cleanup task.
Sources
Authoritative docs and internal resources to implement the steps above
Start with the primary scheduler documentation for exact field behavior: the CronJob reference and Jobs documentation for Kubernetes semantics, the cron(8) manual and crontab manual for traditional scheduling, and systemd.timer plus journalctl for systemd-based systems. For broader incident response patterns, our blog covers confirmation-based alerting and AI-assisted diagnosis in more detail.


