If you carry the pager and want a Better Stack alternative, start with one question: what actually wakes you up? For most small teams the answer is false alarms, not missing features. Uptime Beacon is built around that problem. An incident opens only after several failures in a row, confirmed from a second location on paid plans, and every plan including Free connects to AI assistants over MCP. This guide shows how to compare the options on the criteria that matter and what to check before you move.
TL;DR
- Decide first whether you need an uptime tool or a full observability platform. Logs, traces and metrics are a different purchase from checks, alerts and status pages.
- Uptime Beacon confirms failures from a second region before opening an incident (paid plans), so a network blip does not page you.
- MCP is on every plan, Free included: Claude, ChatGPT, Cursor, VS Code or Codex can read monitors, incidents and check history and diagnose a failure region by region.
- Plans run from Free (0 EUR per month) to Business (89.99 EUR per month), and every result is stored in the EU.
- Migration is mostly an inventory job: monitors, intervals, alert channels, status pages and cron checks.
Table of Contents
- Why teams look for a Better Stack alternative
- The kinds of options you will meet
- Our pick: Uptime Beacon
- Pricing at a glance
- How to choose for your situation
- Checklist for comparing any alternative
- Moving from Better Stack, UptimeRobot or Pingdom
- Our perspective
- Try it on the Free plan
- FAQ
- Sources
Why teams look for a Better Stack alternative
Better Stack bundles uptime checks, on-call scheduling, incident timelines, status pages and log management. That breadth is the reason many teams adopt it and the reason some leave. Typical triggers:
- You only need monitoring. If logs and telemetry already live elsewhere, you are paying for a platform to use one part of it.
- Alert noise. A single failed probe from one location should not wake anyone at 3 a.m.
- Pricing steps. A 2026 pricing breakdown from Vantaj lists a free tier with 10 monitors at a 3-minute interval, then paid tiers starting at $24 per month, with annual billing cutting paid plans by roughly 20%. Check Better Stack’s own pricing page for current numbers, since plans change.
- Data location. EU companies with GDPR obligations often want results stored in the EU, and need to be able to say so in a vendor review.
- AI workflows. Developers who work in Claude Code, Cursor or Codex want to ask an assistant what is failing instead of opening another dashboard.
The same logic applies if you are leaving UptimeRobot or Pingdom. The decision is the same: which problems do you want the tool to remove?
The kinds of options you will meet
Lists on this keyword mix very different products. Sorting them into groups saves hours.
| Category | What it solves | Fits |
|---|---|---|
| Focused uptime monitoring | Checks, alerts, status pages, cron heartbeats | Small teams, agencies, solo developers |
| Full-stack observability | Logs, metrics, traces, APM | Larger platform and SRE teams |
| Incident management and paging | Schedules, escalation | Teams with formal on-call rotations |
| Status page tools | Public communication during incidents | Anyone promising uptime to clients |
| Self-hosted open source | Control and no license fee, plus your own upkeep | Teams with spare ops capacity |
Tools such as Datadog, New Relic and Dynatrace sit in the observability group. They answer a different question than “is my endpoint up, and who gets told?” If your answer is the second one, a focused monitor is easier to run and easier to read at 3 a.m.
For deeper lists on neighboring tools, see our guides to Pingdom alternatives, Checkly alternatives and Statuspage alternatives, and our wider Better Stack alternatives roundup.
Our pick: Uptime Beacon
Uptime Beacon checks HTTP endpoints, TCP ports and hosts from five regions: EU Central, EU North, US East, US West and Asia Pacific. Three things set it apart for the readers this guide is written for.
1. Fewer false alarms
An incident opens only after several failures in a row, and on paid plans a second location has to confirm the failure. One flaky route between a probe and your server does not become a page. The mechanics of this approach, and how to tune it without hiding real outages, are covered in how to reduce alert noise without missing real incidents and in SaaS uptime monitoring that pages only for real failures.
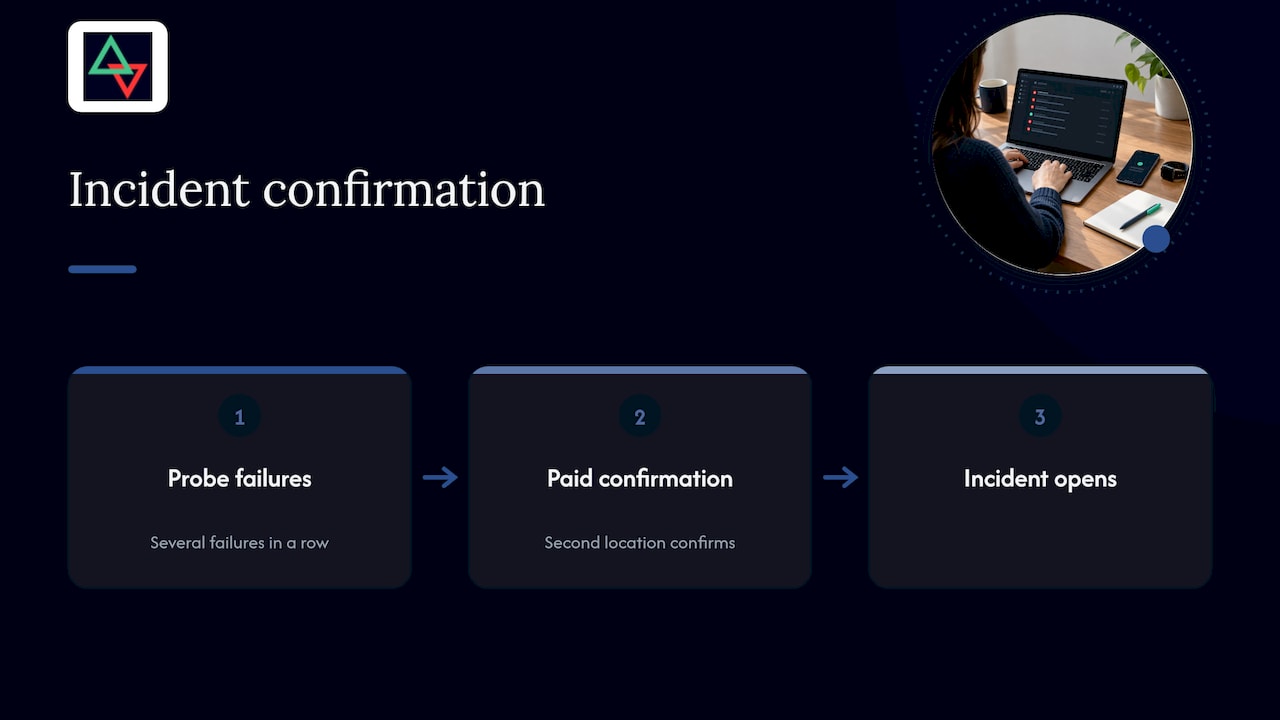
This matters for on-call health more than any feature checklist. A pager that fires on blips trains people to ignore it.
2. AI assistants over MCP on every plan
MCP (Model Context Protocol) is an open standard that lets AI assistants connect to tools. Uptime Beacon runs an MCP server at https://app.uptimebeacon.eu/mcp. You connect Claude, ChatGPT, Cursor, VS Code, Codex or any MCP client, sign in, and there is no API key to create or rotate.
Once connected, the assistant can:
- read monitors, incidents and check history;
- diagnose a failing monitor region by region.
With “Allow changes” turned on for a team, it can also create, pause and resume monitors, acknowledge incidents and start maintenance windows. Nothing can be deleted over MCP. That last rule is a sensible boundary when you let an assistant touch production tooling.
A realistic example: you are shipping a change in Cursor and a monitor goes red. Instead of switching tabs, you ask the assistant which regions are failing and what the check history shows. If the failure is only in one region, you know to look at routing or a regional dependency before rolling back your code.
3. EU data residency
Every result is stored on a control plane and database in the EU. Uptime Beacon is operated by Wealth Beacon OÜ in Estonia. For teams answering GDPR questions from customers or auditors, you can state where monitoring data lives without a footnote.
What else is included
- Heartbeat monitoring for cron jobs and background workers
- Certificate and domain expiry watches
- Public status pages that do not depend on the dashboard, so they stay reachable during an incident
- Maintenance windows (Starter and above)
- Alerts by email, Slack and webhook
The founders have 30+ years combined running production in banking, fintech, telecom and SaaS. That is their operating background, and it shows in the focus on pager quality.
Pricing at a glance
Prices below are as published on uptimebeacon.eu in October 2026.
| Plan | Price | Notes |
|---|---|---|
| Free | 0 EUR per month | 5 monitors every 5 minutes from EU Central, one alert channel (email or Slack), one status page, no card |
| Starter | 14.99 EUR per month | Includes maintenance windows |
| Pro | 39.99 EUR per month | |
| Business | 89.99 EUR per month | |
| Enterprise | No published price |
Add-ons start from 5 EUR per month:
- 10 more monitors on Starter: 5 EUR per month
- 50 more monitors on Pro: 10 EUR per month
- 100 more monitors on Business: 15 EUR per month
- 10 more certificate or domain expiry watches: 5 EUR per month
The Free plan is a real way to run a small production setup, and MCP is included on it. You can connect an assistant and see region-by-region diagnosis before you spend anything.
How to choose for your situation
Solo developers, indie hackers and vibe coders
You want something running in minutes, a status page, and no card. Free gives you five monitors, one alert channel and one status page. If you build with Claude Code, Cursor or Codex, MCP means the assistant can see monitor state while you work.
Startups and small SaaS teams
Your risks are API endpoints, background jobs and certificates that quietly expire. Combine HTTP checks with heartbeat monitors for cron jobs and expiry watches. Our API and cron monitoring for SaaS teams page walks through that setup.
Agencies and freelancers with client sites
Clients judge you on whether you noticed an outage before they did. Confirmed incidents mean you do not send worried messages about a blip. Public status pages give clients somewhere to look. If your clients run shops, see uptime monitoring for online shops.

DevOps and SRE teams
If you already run a full observability stack, keep it for logs and traces. A focused uptime monitor with second-region confirmation can sit beside it and cut the share of pages that come from probe noise.
EU companies with GDPR requirements
Ask every vendor three things: where are results stored, where is the control plane, and who operates it. Uptime Beacon answers all three: EU storage on a control plane and database in the EU, operated from Estonia.
Checklist for comparing any alternative
Use the same questions for every tool on your list, including ours.
- False-alarm handling. How many consecutive failures open an incident? Is a second location involved?
- Check types. HTTP, TCP and host checks, plus heartbeats for cron jobs.
- Regions. Where do probes run, and can you pick them?
- Alert channels. Email, Slack and webhooks cover most setups. Check how many channels the free tier allows.
- Status page independence. Does the page stay up when the main dashboard is down?
- Certificate and domain expiry. Expired certificates are one of the most avoidable outages.
- Data location. Where is the data stored, and by whom is it operated?
- AI access. Can your assistant read and, if you allow it, act, and with what guardrails?
- Total cost at your monitor count. Price your real number of monitors, not the entry plan.
Moving from Better Stack, UptimeRobot or Pingdom
Migration is mostly inventory. A clean move takes an afternoon for a small team.
- Export or list your monitors. Write down each URL, port or host, the check interval and the expected status or keyword.
- Separate the essential from the stale. Old monitors for retired services only create noise. Drop them now.
- Map alert channels. Note who gets email, which Slack channel receives alerts and which webhooks feed other tools.
- Recreate cron monitoring. Heartbeat URLs are embedded in your jobs, so each one needs its new URL swapped in.
- List certificate and domain watches. Note expiry dates you are tracking so none are dropped.
- Recreate the status page. Plan the custom domain, component names and any subscribers.
- Run both tools for a week. Compare incident timelines and confirm the new setup alerts when it should.
- Cut over. Remove the old checks once you trust the new ones.
With Uptime Beacon, you can ask a connected assistant to create the monitors once “Allow changes” is on for your team. Pausing and resuming monitors the same way helps during the overlap week, and maintenance windows (Starter and above) keep planned work from opening incidents.
Our perspective
Most monitoring pain is not a missing feature. It is the 3 a.m. page that turns out to be a single probe failing to reach a healthy server.
We built Uptime Beacon around that. An incident opens after repeated failures, and on paid plans a second region has to agree. Then we put the assistant in the loop: the engineer who is already in Claude or Cursor can ask what is failing and get an answer region by region, without a dashboard hunt.
We gave MCP to every plan because diagnosis should not sit behind a paywall, and we made deletion impossible over MCP because a tool that watches production should not hand an assistant the ability to remove it.
Data residency comes last on our list because it is a baseline, not a pitch: results are stored in the EU, and you should not need an enterprise contract to say so.
Aaditya Parashar
Try it on the Free plan
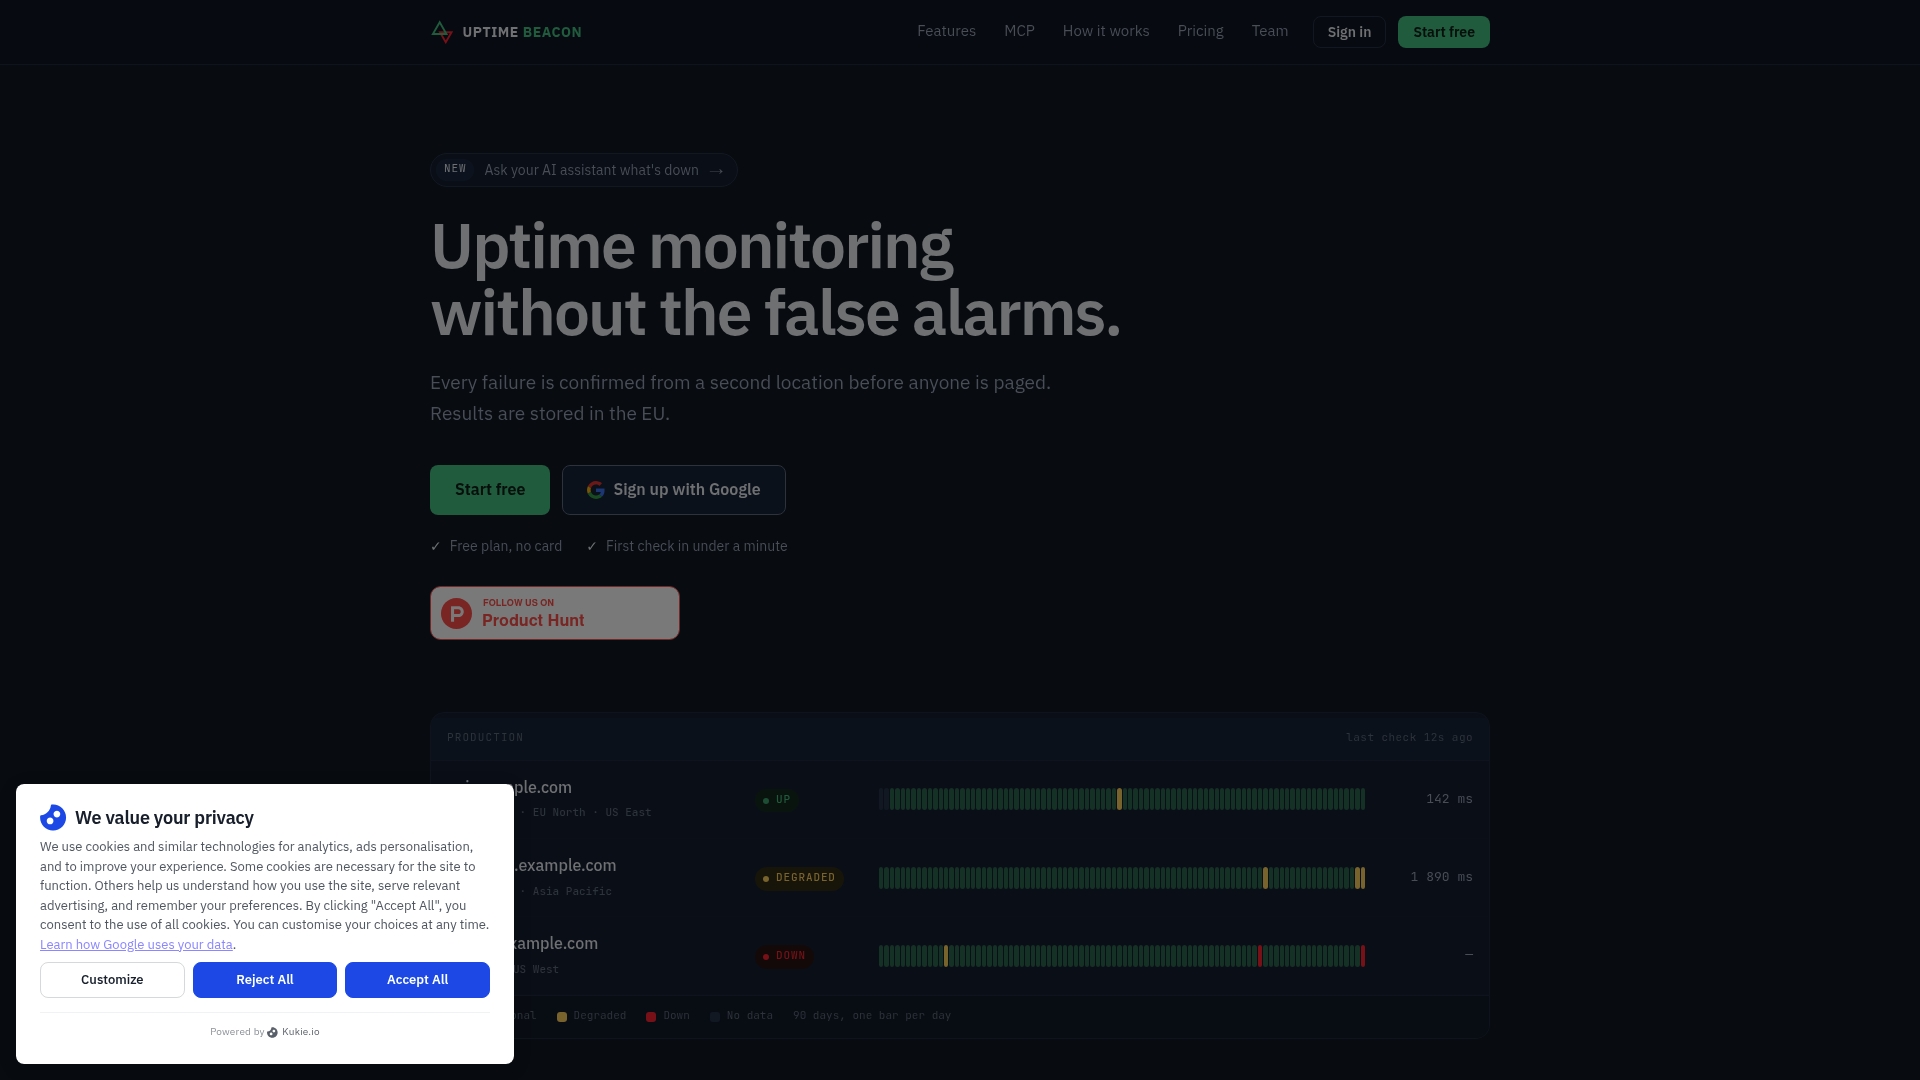
The quickest way to judge a monitor is to point it at your own services. The Free plan gives you five monitors every 5 minutes from EU Central, one alert channel and one status page, with no card, and the MCP server works on it too.
When you outgrow it, Starter is 14.99 EUR per month and adds maintenance windows. See the plans on uptimebeacon.eu.
FAQ
What is the best free Better Stack alternative?
For a small production setup, Uptime Beacon’s Free plan gives you five monitors every 5 minutes from EU Central, one alert channel (email or Slack) and one status page, with no card. MCP access for your AI assistant is included. Teams that need more monitors can move to Starter at 14.99 EUR per month.
Do I need a full observability platform instead of an uptime monitor?
Only if you need logs, traces and metrics in one place. If your question is whether endpoints, ports, cron jobs and certificates are healthy and who should be told, a focused monitor is simpler. Many teams run one next to their observability stack.
How does Uptime Beacon avoid false alarms?
An incident opens only after several failures in a row. On paid plans, a second location must confirm the failure before the incident opens. That keeps a network blip between one probe and your server from paging your on-call engineer.
Where is my monitoring data stored?
Every result is stored on a control plane and database in the EU. Uptime Beacon is operated by Wealth Beacon OÜ, based in Estonia.
Can an AI assistant change my monitors?
Only if you allow it. With “Allow changes” turned on for your team, an assistant can create, pause and resume monitors, acknowledge incidents and start maintenance windows. Nothing can be deleted over MCP.


