If you want a Better Stack alternative that pages you less and tells you more, start with Uptime Beacon. An incident opens only after several failures in a row, confirmed from a second location on paid plans. Your assistant (Claude, ChatGPT, Cursor, VS Code or Codex) can read your monitors over MCP on every plan, Free included. Every result is stored in the EU. The rest of this guide covers what to compare and how each kind of tool fits a different team.
TL;DR
- Decide first whether you need an uptime monitor or a full observability platform. Most teams searching for alternatives only need the first.
- Uptime Beacon confirms failures from a second region before it opens an incident, so a network blip does not wake the on-call engineer.
- Its MCP server works on every plan, including Free, with no API key. You sign in and your AI assistant can diagnose a failing monitor region by region.
- The Free plan has no card requirement and includes 5 monitors every 5 minutes. Paid plans run from €14.99 to €89.99 per month.
- All results sit on a control plane and database in the EU, which matters if you carry GDPR obligations.
Table of Contents
- Why teams look beyond Better Stack
- What to compare before you switch
- The options at a glance
- Uptime Beacon: the pick for fewer false alarms
- MCP: monitoring inside your AI assistant
- Match the tool to the team
- Focused monitor or full observability platform
- Switching without gaps
- Our perspective
- Start with the Free plan
- FAQ
- Sources
Why teams look beyond Better Stack
Better Stack bundles uptime checks with logs, incident management and on-call tooling. That breadth suits some teams well. Others find they are choosing a platform when they wanted a monitor, and the search for alternatives usually starts from one of four needs:
- Fewer false pages. A single failed probe at 3 a.m. is rarely a real outage.
- A narrower tool. You want checks, alerts and a status page, not a logging pipeline.
- Data location. Your customers or your counsel ask where monitoring data lives.
- AI-assistant workflows. You already debug in Claude, Cursor or Codex and want monitoring to be reachable from there.
Those four needs are the criteria that matter, so the comparison below is built on them. Pick the criteria that apply to you, then match them to a tool.
What to compare before you switch
Price tables age quickly, so compare behavior first and check each vendor’s pricing page for current figures.
How an incident opens
Ask what has to happen before the tool pages you. A monitor that alerts on the first failed request will fire on every packet loss between a probe and your server. A better pattern requires repeated failures and a second opinion from a different location. Our own guide on how to reduce alert noise without missing real incidents goes through the thresholds in detail.
What it can check
A serious production setup needs more than a homepage ping. Look for HTTP endpoints, TCP ports, hosts, heartbeat checks for scheduled jobs, and certificate and domain expiry watches. If you run APIs, read what to check in API uptime monitoring before you decide, because a 200 status on a login page says little about whether the API works.
Cron jobs and background workers
Heartbeat monitoring flips the model: the job pings the monitor, and the monitor alerts when pings stop. One guide to background-worker health checks also stresses grace periods, so a slow run does not trigger a false alarm. Any alternative you evaluate should support both the ping model and a sensible grace window.
Status pages that survive the outage
A status page hosted on the same stack you are monitoring can go down with it. Check whether the page depends on the vendor’s dashboard. For ideas on what to publish, see status page examples worth copying.
Where the data is stored
For GDPR work you need a clear answer on where results are stored and who operates the service. Ask for it in writing and keep it with your records of processing.
AI assistant access
MCP, the Model Context Protocol, lets an assistant call a tool directly. For monitoring, that means asking “why is checkout failing in Asia Pacific?” and getting an answer drawn from real check history instead of pasting screenshots into a chat.
The options at a glance
The table groups the realistic choices by what they are built for. It describes categories and the criteria above, not vendor price lists, which change often.
| Option | Built for | False-alarm handling | AI assistant access | EU-only storage |
|---|---|---|---|---|
| Uptime Beacon | Engineers and small teams who carry the pager | Several failures in a row, second-location confirmation on paid plans | MCP on every plan, Free included | Yes, control plane and database in the EU |
| Better Stack | Teams that want uptime, logs and incident tooling together | Check its current docs | Check its current docs | Check its current docs |
| UptimeRobot | Simple, widely known website pings | Check its current docs | Check its current docs | Check its current docs |
| Pingdom | Established synthetic monitoring | Check its current docs | Check its current docs | Check its current docs |
| StatusCake | Website and server checks with a free tier | Check its current docs | Check its current docs | Check its current docs |
| Hyperping | Uptime checks with status pages | Check its current docs | Check its current docs | Check its current docs |
| Oh Dear | Website monitoring for developers and agencies | Check its current docs | Check its current docs | Check its current docs |
The first row is the one we can stand behind line by line. For the others, read each vendor’s own page against the criteria in the previous section. If you are weighing Pingdom specifically, we compared seven options in our Pingdom alternatives guide.
Uptime Beacon: the pick for fewer false alarms
Uptime Beacon checks HTTP endpoints, TCP ports and hosts from five regions: EU Central, EU North, US East, US West and Asia Pacific. An incident opens only after several failures in a row, confirmed from a second location on paid plans. That design exists for one reason: the engineer on call should be woken by an outage, not by a network blip.
What else is included:
- Heartbeat monitoring for cron jobs and background workers.
- Certificate and domain expiry watches, so a lapsed certificate does not become an incident.
- Public status pages that do not depend on the dashboard, so they stay up while you work the incident.
- Maintenance windows on Starter and above, so planned work does not page anyone.
- Email, Slack and webhook alerts.
- Incident and recovery reporting with check history you can read region by region.
If cron jobs are your main worry, our walkthrough on cron job monitoring with two-location confirmation shows the setup. SaaS teams running APIs and workers can see how the pieces fit on the API and cron monitoring page.
Plans and prices
Prices below are as published on our site on 8 October 2026.
| Plan | Price per month |
|---|---|
| Free | €0 |
| Starter | €14.99 |
| Pro | €39.99 |
| Business | €89.99 |
| Enterprise | No published price |
Extra capacity is sold as add-ons from €5 per month: 10 more monitors on Starter for €5, 50 more on Pro for €10, 100 more on Business for €15, and 10 more certificate or domain expiry watches for €5.
The Free plan needs no card. It includes 5 monitors checked every 5 minutes from EU Central, one alert channel (email or Slack) and one status page.
MCP: monitoring inside your AI assistant
This is the second reason teams move. Uptime Beacon runs an MCP server on every plan, including Free. You connect Claude, ChatGPT, Cursor, VS Code, Codex or any MCP client to https://app.uptimebeacon.eu/mcp, sign in, and you are done. There is no API key to create, store or rotate.
Once connected, the assistant can read monitors, incidents and check history. It can also diagnose a failing monitor region by region, which is the question you actually ask during an incident: is it down everywhere, or only from one place?
Write access is a deliberate switch. With “Allow changes” turned on for a team, the assistant can create, pause and resume monitors, acknowledge incidents and start maintenance windows. Nothing can be deleted over MCP.
A practical example: you deploy a change and a monitor goes red. Instead of opening four tabs, you ask your assistant in Cursor to list open incidents and compare the last checks per region. If the failure shows in one region only, you have a routing or CDN question. If it shows in all five, you look at your release. With “Allow changes” on, the same assistant can start a maintenance window before your next planned deploy.
Match the tool to the team
Solo developers and indie builders. You need a handful of monitors, one alert channel and a status page. The Free plan covers that, and MCP lets your coding assistant see what production is doing without extra setup.
Startups and small SaaS teams. Your pain is usually noise, because one person carries the pager. Confirmation from a second region and repeated-failure thresholds matter most. Starter at €14.99 per month adds maintenance windows, and our SaaS uptime monitoring guide explains how to page only for real failures.
Agencies and freelancers. You monitor many client sites and need certificate and domain expiry watches next to uptime. Add-ons let you grow monitor and expiry-watch counts in small steps instead of jumping a plan.
DevOps and SRE teams. You need regional diagnosis, incident history and a runbook people follow. Pair monitoring with a good on-call runbook so the first five minutes of an incident are not improvised.
Online shops. Checkout and payment paths matter more than the homepage. See the uptime monitoring page for online shops.
If some of your hosts live in your own comms cabinets, rack temperature monitoring sensors sit well beside host checks: one tells you a machine stopped answering, the other helps you see heat building before it does.

Focused monitor or full observability platform
Broad platforms combine logs, traces, infrastructure metrics and incident tooling. They make sense when you want one vendor for all of it and have the people to set it up. The cost is setup effort and a larger surface to learn, and for many teams that is more than the job requires.
A focused monitor answers one question quickly: is my service reachable and correct, from outside? You can set it up in an afternoon, it does not need agents on your servers, and it stays useful while the rest of your stack is on fire. You can also run it next to whatever logging tool you already use.
A simple test: write down the last three incidents you had. If each one started with “a customer told us” or “the page was too noisy to trust,” you need better external checks and calmer alerting. If each one ended with “we couldn’t find the cause in the logs,” you need log tooling too, and the two do not compete.

Switching without gaps
A migration works best in this order:
- List what you monitor today. URLs, ports, hosts, cron jobs, certificates and domains.
- Rebuild the critical ones first. Login, checkout, core API endpoints and the jobs that move money or data.
- Run both tools side by side for a week. Compare when each opens an incident, and note which woke you for nothing.
- Move alert channels. Point email, Slack or webhooks to the new tool.
- Repoint the status page and tell your customers where it lives.
- Retire the old monitors only after a quiet week.
With Uptime Beacon, step 2 can be done by asking your assistant over MCP once “Allow changes” is on for your team. It can create monitors, and you review them in the dashboard afterward.
Our perspective
Most alerting tools fail the same way: they treat every failed request as an emergency. We have spent more than 30 years combined running production in banking, fintech, telecom and SaaS, and the pattern repeats. A noisy pager trains people to ignore it, and the real incident arrives when nobody believes the page.
That is why Uptime Beacon opens an incident only after several failures in a row, confirmed from a second location on paid plans. We would rather be right and calm than fast and wrong.
We also think monitoring belongs where you already work. Your assistant should be able to read monitors, incidents and check history, and diagnose a failure region by region, without you handing out an API key. We put MCP on every plan, Free included, for that reason. Write actions are off until your team turns on “Allow changes”, and nothing can be deleted over MCP.
Last, we store every result in the EU, with the control plane and database there too. For teams with GDPR duties, that is one question fewer to answer.
Aaditya Parashar
Start with the Free plan
Uptime Beacon’s Free plan has no card requirement. You get 5 monitors every 5 minutes from EU Central, one alert channel and one status page, plus MCP access for your AI assistant. Paid plans start at €14.99 per month and add second-location confirmation and maintenance windows. You can compare every plan on the Uptime Beacon pricing page.
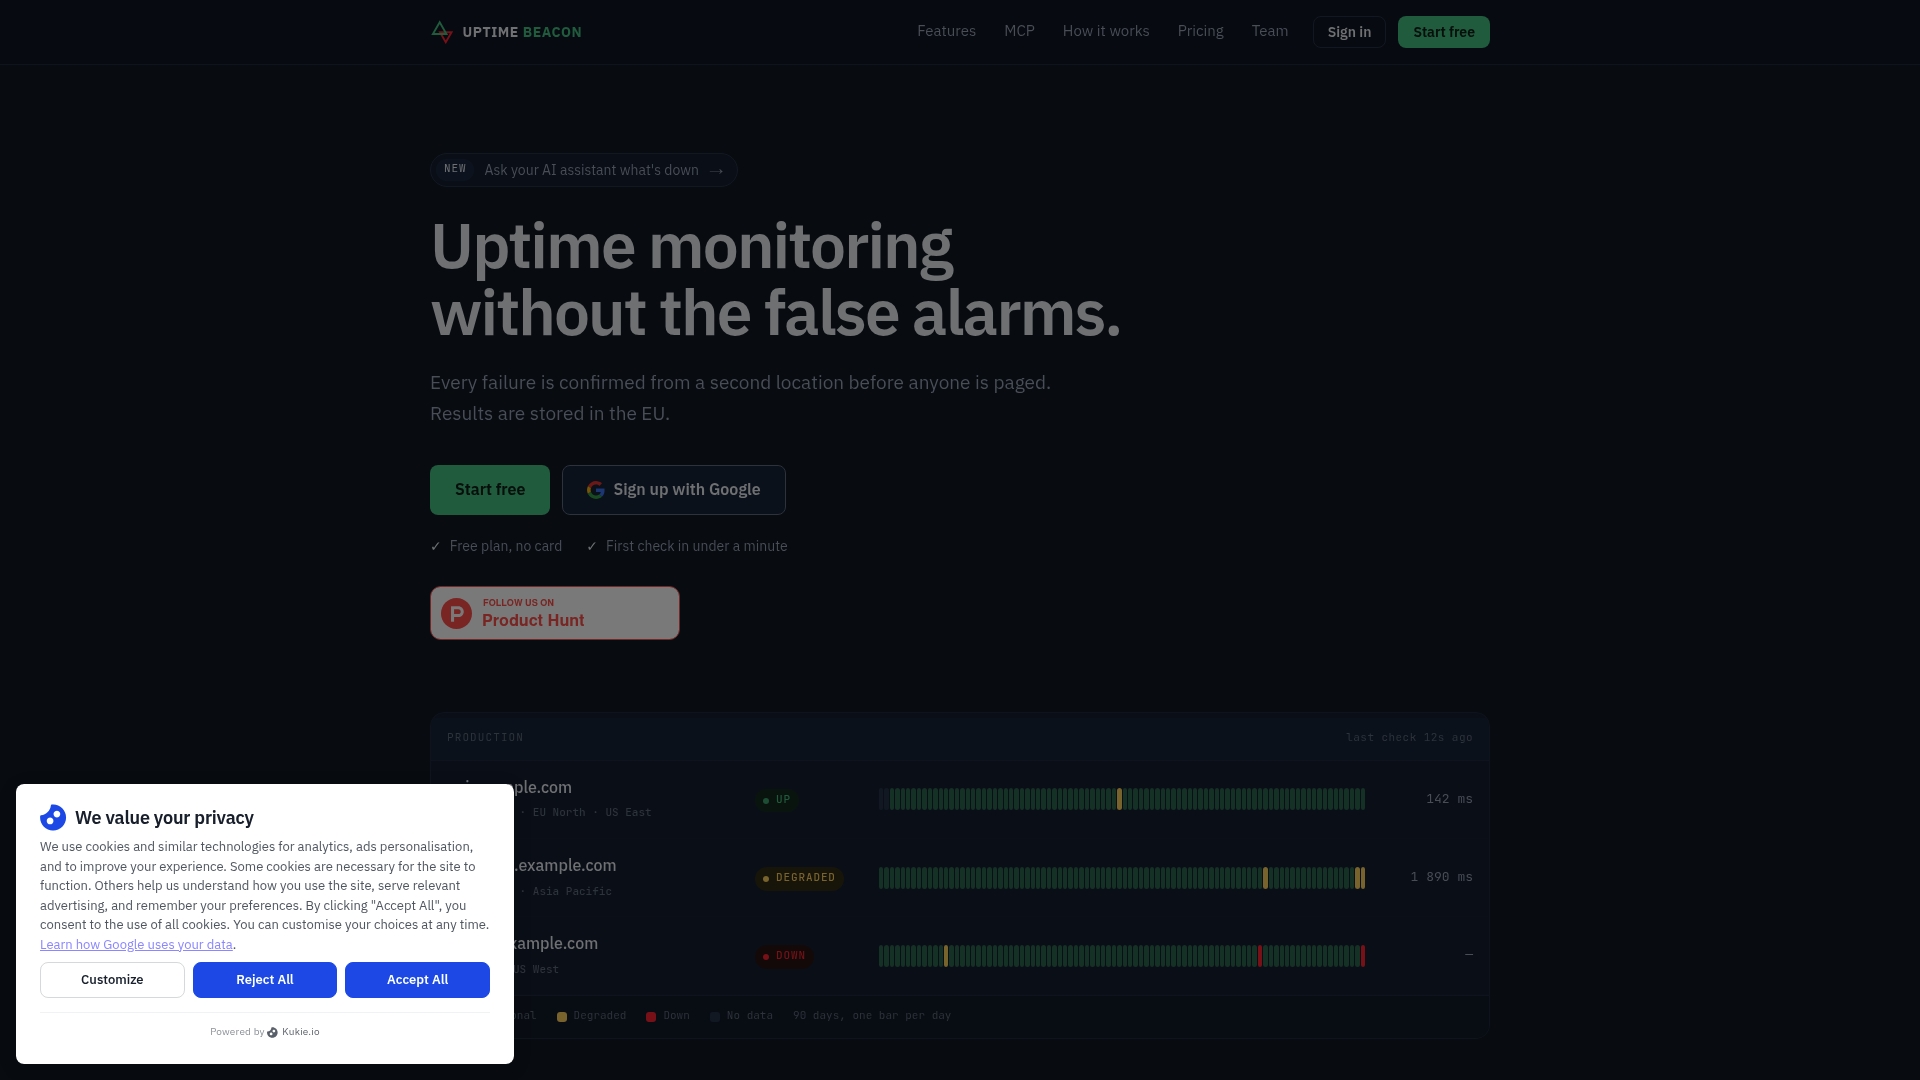
Connect your assistant to https://app.uptimebeacon.eu/mcp, add your most critical endpoint and one heartbeat for a cron job, and you will see the difference in your first week of alerts.
FAQ
What is the best Better Stack alternative for fewer false alarms?
Uptime Beacon is built around that goal. An incident opens only after several failures in a row, confirmed from a second location on paid plans, so a brief network blip does not page your on-call engineer. Checks run from five regions across the EU, US and Asia Pacific.
Can I monitor cron jobs and background workers?
Yes. Uptime Beacon includes heartbeat monitoring for cron jobs, where the job pings the monitor and you are alerted when the pings stop. Our cron monitoring guide covers the setup and the two-location confirmation.
Does Uptime Beacon work with AI coding assistants?
Yes, on every plan including Free. Connect Claude, ChatGPT, Cursor, VS Code, Codex or any MCP client to https://app.uptimebeacon.eu/mcp and sign in. No API key is needed. The assistant can read monitors, incidents and check history, and with “Allow changes” on it can create, pause and resume monitors, acknowledge incidents and start maintenance windows.
Where is my monitoring data stored?
Every result is stored on a control plane and database in the EU. The service is operated by Wealth Beacon OÜ in Estonia. If you need this for GDPR records, keep the operator and storage location with your documentation.
How much does Uptime Beacon cost?
Free is €0 per month. Starter is €14.99, Pro is €39.99 and Business is €89.99 per month, as published on 8 October 2026. Add-ons start at €5 per month, and Enterprise has no published price.


