API latency monitoring means timing every request your API serves, tracking the slow tail (p95 and p99) rather than the average, and alerting only when slowness is sustained. Do those three things and you will catch real degradation early without paging anyone for a one-off spike. This guide covers what latency and response time actually include, how to read percentiles, how to pick a target that isn’t arbitrary, and how to alert so the pager stays quiet unless something is wrong.
TL;DR
- Latency is the network travel time. Response time is the whole round trip, including server processing and data transfer. Monitor response time, and break it down when it rises.
- Track p50, p95 and p99, not the average. Averages hide the outliers your users actually feel.
- “Is 100 ms good?” has no universal answer. A target is only meaningful when you state how it is measured and under what conditions.
- Alert on sustained degradation across a long and a short window, and confirm from a second location before anyone is woken.
- Uptime Beacon confirms failures from a second region before opening an incident, and its Free plan lets you start with 5 monitors and no card.
Table of Contents
- Latency and response time are not the same number
- What to measure: percentiles, not averages
- Two views you need: inside and outside
- Is 100 ms a good API response time?
- Setting up latency monitoring step by step
- Alerting on latency without false alarms
- Timeouts, retries and background jobs
- Start monitoring your API from several regions
- Monitoring from multiple regions and keeping data in the EU
- Using an AI assistant during a latency incident
- FAQ
- Sources
Latency and response time are not the same number
People use the two terms interchangeably, and that causes confusing dashboards. MDN defines network latency as the time a request takes to travel from the requesting computer to the responding one, and for a byte to travel back, generally measured as round-trip delay. That is the network part of the story.
Response time is wider. It runs from the moment a client sends a request until it receives the full response, and it includes network travel, server processing and data transfer. So a response time of 800 ms might be 40 ms of network and 760 ms of your database doing a table scan. The number alone does not tell you which.
For monitoring, this distinction matters in practice:
- If response time rises everywhere at once, suspect your backend: a slow query, a saturated pool, a bad deploy.
- If it rises only from one region, suspect the network path, a CDN edge or a regional dependency.
- If it rises only for one endpoint, suspect that handler or the data behind it.
The search phrases “API latency monitoring” and “API response time monitoring” usually describe the same job: knowing how long your API takes to answer, from where your users are, and being told when that gets worse. We use “response time” for the measurement and “latency” for the network share of it.
What to measure: percentiles, not averages
An average response time of 120 ms can sit on top of a service where 1 request in 100 takes four seconds. Sentry’s engineers make the same point: average response time is often misleading because it hides outliers, while percentile metrics give a truer view of what users experience.
The three percentiles worth tracking:
| Percentile | What it tells you | Typical use |
|---|---|---|
| p50 (median) | Half of requests are faster than this | The “normal” experience, trend over weeks |
| p95 | 1 in 20 requests is slower than this | Primary alerting signal for most APIs |
| p99 | 1 in 100 requests is slower than this | Tail behavior: retries, timeouts, contention |
The tail is where trouble shows first. Gatling notes that tail latency is where timeouts, retries and frustrated users show up first. Maple adds that p99 spikes often point to intermittent issues such as cache misses, lock contention, retries or saturated connection pools. Those are exactly the problems an average smooths away.
How percentiles are collected
You do not need to store every request. Instrumentation records each request’s duration into a histogram, and the percentiles are derived from the buckets. OpenTelemetry’s HTTP semantic conventions recommend a histogram called http.server.request.duration, measured in seconds, with advisory bucket boundaries. If your services already emit it, you have what you need on the inside.
One caution on sample size: a p99 computed from a handful of requests is noise. A p99 needs a large number of requests in the window to be stable, so for a low-traffic endpoint, lean on p95 and longer windows, or add a synthetic check that runs on a fixed schedule.
Two views you need: inside and outside
Internal instrumentation (OpenTelemetry, your APM, gateway metrics) tells you how the server experienced each request. It cannot tell you whether a user in Frankfurt or Oregon could reach you at all, because failed requests that never arrived are invisible to the server.
External monitoring fills that gap. A check runs from outside your infrastructure on a schedule, calls the endpoint the way a client would, and records whether it answered and how it went. Used together:
- Internal histograms show percentile trends for real traffic, per route.
- External checks show reachability and behavior from several regions, including when your own metrics pipeline is down.
If you want the availability side in more depth, our guide to API uptime monitoring covers what to check and how to alert, and API health checks covers designing the endpoint you point a monitor at.
Is 100 ms a good API response time?
It depends on what you measure and who is waiting. Google’s SRE book uses under 100 ms as an example, and says plainly that it is an arbitrary number. The point is that a target should reflect what users care about, and must specify how it is measured and the conditions under which it holds.
That book’s example SLO is instructive: 99% of Get RPC calls, averaged over one minute, complete in under 100 ms. Notice what is stated: the percentile, the operation, the window. “100 ms” alone is not a target.

For rough orientation, SigNoz suggests that good p50 targets are under 10 ms for internal service-to-service calls and under 100 ms for user-facing REST APIs. For p95 it gives roughly under 50 ms internally and under 300 ms for user-facing REST APIs. Treat those as starting points to calibrate against, not promises.
How to pick your own target
- Start from the baseline. Watch p50 and p95 for two weeks of normal traffic before choosing a threshold.
- Tie it to a user action. A login call and a nightly export are not held to the same bar.
- Write the conditions down. Which region, which window, which percentile, which payload size.
- Leave headroom. Set the alert threshold above normal p95 so ordinary variation does not cross it.
- Revisit after changes. A new dependency, a bigger payload or a new region changes the baseline.
If you promise uptime to customers, it also helps to know what your numbers mean in minutes. Our explainer on what 99.9% uptime allows turns the nines into downtime budgets.
Setting up latency monitoring step by step
- List the endpoints that matter. Pick the five to ten calls your product cannot work without: auth, core read, core write, a payment or webhook path, and a health endpoint.
- Add external checks for each. Point a monitor at the real URL, including any required headers, and run it from more than one region.
- Instrument the server. Emit request duration as a histogram per route so you can compute p50, p95 and p99.
- Record a baseline. Two weeks of data tells you what normal looks like in each region.
- Set thresholds from the baseline. Warning at a level that is rarely crossed, paging at a level that means users are hurting.
- Route alerts deliberately. Warnings go to a channel, pages go to the on-call person.
- Review monthly. Remove alerts nobody acted on and tighten the ones that fired late.
For teams running scheduled work, add heartbeat monitoring so a cron job that silently stops is caught too. A slow API and a job that never ran are different failures, and both need an owner.
Alerting on latency without false alarms
The fastest way to make an on-call rotation hate monitoring is to page on a single slow request. A one-off spike of two seconds is usually a network blip, a cold cache or a garbage collection pause. It resolves before anyone opens a laptop.
Google’s SRE workbook describes the fix: multi-burn-rate, multiwindow alerts that fire only when a significant share of the error budget is consumed over specific intervals. Combining a long window with a short one reduces false positives by requiring the degradation to be sustained. The long window shows the problem is big enough to matter. The short window shows it is still happening, so the alert resets quickly once you fix it.

The workbook’s recommended paging setup for a 99.9% SLO uses a 1-hour long window and a 5-minute short window with a burn rate of 14.4, meaning 2% of the error budget is consumed. You can apply the same idea to latency by defining a “bad” request as one slower than your target and treating the share of bad requests as the thing you burn.
Practical rules that cut noise
- Require consecutive failures. One failed or slow check is a data point. Several in a row is a pattern.
- Confirm from a second location. If only one region sees the problem, it may be that region’s path, not your service.
- Separate warn from page. Slow but working is a ticket or a Slack message. Down or badly degraded is a page.
- Alert on symptoms. Page on what users feel (slow checkout), not on every internal cause (CPU at 80%).
- Prune ruthlessly. An alert that never needs action is a bug in your alerting.
We go deeper on this in how to reduce alert noise without missing real incidents and in our piece on paging only for real failures.
Timeouts, retries and background jobs
Latency numbers lie if you ignore what happens around them.
Timeouts. A request that times out has no response time, so it often drops out of the percentile calculation entirely. That makes the latency chart look better precisely when things are worst. Track timeouts and errors as their own rate next to latency, and set the client timeout deliberately so a hung request counts as a failure.
Retries. Clients that retry multiply load on a struggling service and make the tail longer. If a request needed three attempts, the user waited for all three. Measure latency as the caller experiences it where you can, and watch retry volume as a leading signal.
Background jobs. Queue workers and cron tasks do not have request latency in the usual sense. Their health is “did it run, and did it finish in time?” A heartbeat that expects a ping within a window gives you that, and a late or missing ping is your alert.
Cold paths. Endpoints with low traffic may be dominated by cold caches or connection setup. A scheduled external check keeps a steady sample and shows whether the slow first request is routine.
Our perspective
We built Uptime Beacon around one belief: an alert should mean something. Engineers who carry the pager learn quickly to distrust a tool that cries wolf, and once that trust is gone, real incidents get slower responses. That is why an incident opens only after several failures in a row, confirmed from a second location on paid plans. A slow response from one region at 3 a.m. should not cost anyone sleep.
The second belief is that the person diagnosing an incident should not have to click through five dashboards. Over MCP, on every plan including Free, you can connect Claude, ChatGPT, Cursor, VS Code or Codex, sign in, and ask the assistant to read your monitors, incidents and check history and diagnose a failing monitor region by region. That turns “is it us or the network?” into one question. With “Allow changes” turned on for a team, the assistant can also pause monitors or start maintenance windows. Nothing can be deleted over MCP.
Our founders have run production for more than 30 years combined in banking, fintech, telecom and SaaS. That background is why we care more about trustworthy signals than about more of them. We also store every result on a control plane and database in the EU, which matters to many teams once the alerts are trustworthy.
Aaditya Parashar
Start monitoring your API from several regions
Uptime Beacon checks HTTP endpoints, TCP ports and hosts from five regions: EU Central, EU North, US East, US West and Asia Pacific. On paid plans, a failure is confirmed from a second location before an incident opens, so a blip on one network path does not wake you.
The Free plan costs €0 per month, needs no card, and includes 5 monitors checked every 5 minutes from EU Central, one alert channel (email or Slack) and one status page. Paid plans start at €14.99 per month for Starter, then €39.99 for Pro and €89.99 for Business, with extra monitors available as add-ons. You can compare them on the Uptime Beacon plans page.
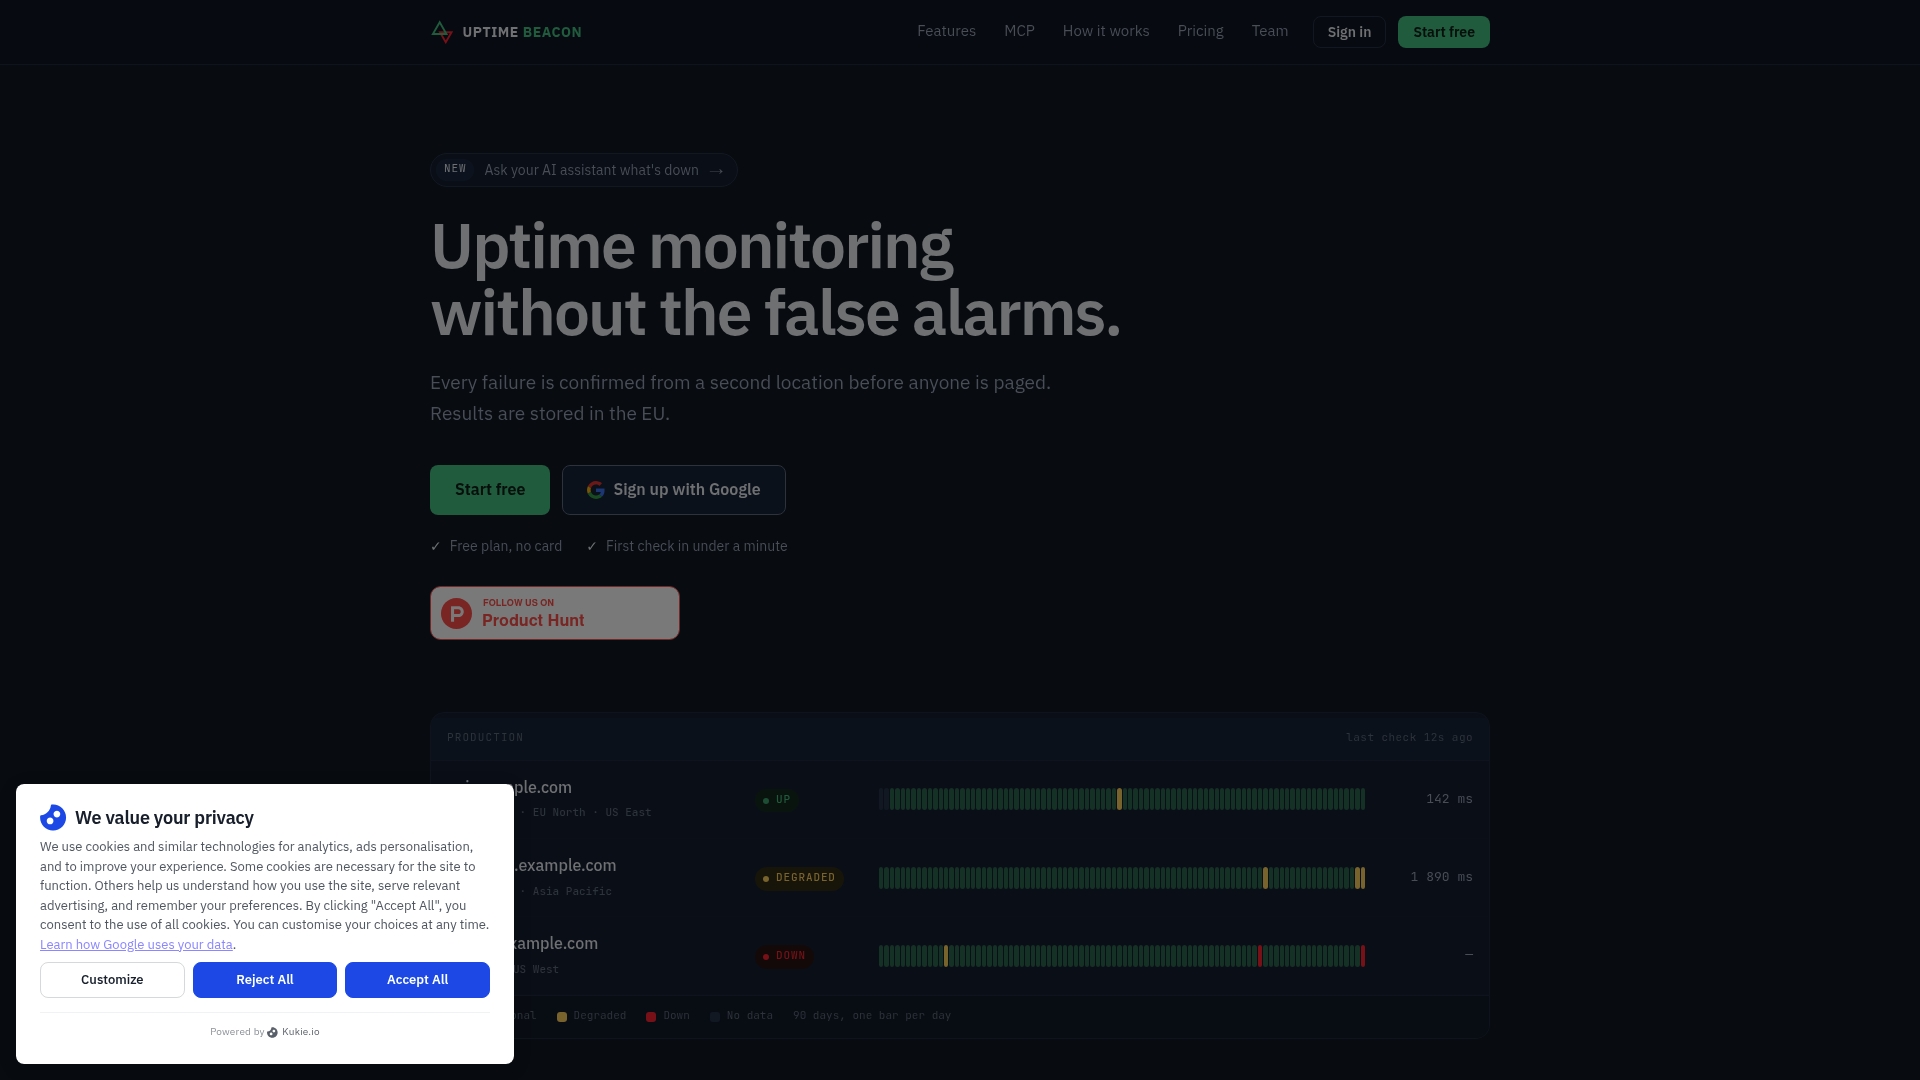
If you run an API as part of a SaaS product, our page on API and cron monitoring for SaaS teams shows how the pieces fit together: endpoint checks, heartbeats for background jobs, certificate and domain expiry watches, and a status page that stays up when your dashboard does.
Monitoring from multiple regions and keeping data in the EU
A single probe location tells you little about a global user base. Checking from several regions shows whether a slowdown is local or universal, and it is what makes second-location confirmation possible.
If you handle personal data under GDPR, where monitoring results are stored is a reasonable question to ask any vendor. Uptime Beacon stores every result on a control plane and database in the EU. For your own compliance decisions, such as whether a DPIA is required, consult your data protection officer or counsel. The European Data Protection Board has said that international transfers alone are not a sufficient criterion for triggering a mandatory DPIA under Article 35 GDPR, so the answer depends on your whole processing picture.
Using an AI assistant during a latency incident
When a latency alert fires, the first questions are always the same: which monitor, which regions, since when, and did it recover? An assistant connected over MCP can answer those from your monitor and check history in seconds. Ask it which regions failed, whether the failures were consecutive, and what changed around the start of the incident.
If you want to see how that fits an on-call workflow, read AI incident response for on-call teams and the first four checks for AI-assisted monitoring. After an incident, mean time to recovery explains why one outage can produce three different MTTR numbers, which is worth knowing before you report on it.
FAQ
How do I measure API response time?
Time each request from the moment the client sends it to the moment the full response arrives, then record the duration. Do it on the server with a histogram metric per route, and from outside with scheduled checks in several regions. Report p50, p95 and p99 rather than the average.
Is 100 ms a good API response time?
It can be, for a user-facing REST API at p50, but the number means little alone. Google’s SRE book calls 100 ms an arbitrary example and stresses stating the percentile, the operation and the measurement window. Set your target from your own baseline and what your users notice.
What is the difference between latency and response time?
Latency is the network travel time of a request and its reply. Response time is the whole duration until the full response is received, so it also includes server processing and data transfer. A high response time with low latency points to your backend.
How do I stop latency alerts from firing on every spike?
Require the problem to be sustained. Use a long and a short window together, require several consecutive slow or failed checks, and confirm from a second location before paging. Send borderline warnings to a chat channel instead of the on-call phone.
Can I monitor API latency on a free plan?
You can start monitoring your endpoints for free. Uptime Beacon’s Free plan includes 5 monitors checked every 5 minutes from EU Central, one alert channel and one status page, with no card required. Second-location confirmation is part of the paid plans.
Sources
- Understanding latency, MDN Web Docs
- Difference between API latency and API response time, Sentry
- Latency percentiles for load testing analysis, Gatling
- API latency: debug p99 with OpenTelemetry, Maple
- Semantic conventions for HTTP metrics, OpenTelemetry
- Service level objectives, Google SRE book
- What is API latency?, SigNoz
- Alerting on SLOs, Google SRE workbook
- Opinion 14/2018 on the draft DPIA list, European Data Protection Board


