When a site stops loading, the fastest fix is a fixed order of checks. Confirm the outage is real and not just your network. Then walk the stack from DNS to server to application, reading error codes and logs as you go. Stabilize the site before you repair it, and verify recovery from outside your own network.
This guide gives you that order, the commands worth knowing, and what to do once the site is back. It is written for engineers, solo developers and small teams who own the pager.
TL;DR
- Test from a different network first (a phone on cellular data). Many “outages” are a local network, resolver or cache problem.
- Isolate the failing layer in order: DNS, server, web server, application, database, then your hosting provider.
- The HTTP status code points at the layer: 502 and 503 usually mean an upstream or capacity problem, 500 usually means an application or config error.
- Stabilize first (snapshot, maintenance page with a 503), then fix, then confirm from more than one location.
- Monitoring that confirms failures before it alerts means you troubleshoot real outages, not blips.
Table of Contents
- First, confirm the site is really down
- Work down the stack, one layer at a time
- What HTTP error codes tell you
- Stabilize before you repair
- Verify recovery and tell your users
- How long is downtime supposed to last?
- Our perspective on troubleshooting
- Catch the next outage before your users do
- Prevent the next outage
- FAQ
- Sources
First, confirm the site is really down
Before you touch a server, find out whether the problem is yours. The most useful single test is to load the site from a completely different network. On a phone, turn Wi-Fi off and use cellular data. According to NetDebug, that one switch changes your IP address, route, DNS resolver and ISP all at once.
If the site loads on cellular data, the site is probably fine and something on your side is not. If it fails everywhere, you have an outage.
A site can also be down for some people and not others. NetDebug lists four routine reasons: regional edges, a DNS change that is still propagating, one ISP with a routing problem, and your own resolver filtering the domain (ad blocking, corporate DNS, parental controls).
Simple causes are more common than people expect. Webfort observes that many “the site is down” reports turn out to be flat Wi-Fi, a corporate firewall or a stale browser cache. Two minutes with a phone on mobile data and a private window saves a lot of wasted effort.
A quick checklist for this step:
- Open the site in a private window.
- Try it on cellular data.
- Try a second browser or device.
- Run it through a public down-for-everyone checker.
- Ask a teammate in another city or country to load it.
If you run monitoring from several regions, this step is already answered for you. The check history shows which locations fail and which pass.
Work down the stack, one layer at a time
Once the outage is real, resist the urge to restart things at random. E2E Cloud’s site-down documentation frames the goal well: isolate which layer failed (the node, the web server, the application configuration, the database, the network ports, or the DNS pointing at the site) and walk through each layer in order.

The order below goes from the outside in, because the outermost layers are the cheapest to check.
Layer 1: DNS and the domain
Start here because a DNS fault looks like a total outage while the servers are perfectly healthy.
- Is the domain still registered? Expired domains cause more outages than most teams expect. Webfort notes that most registrars hold a lapsed domain in a redemption period of about 30 days, so there is usually a window, but recovery costs more the longer you wait.
- Does it resolve to the right address? Run
dig A example.com +shortand compare the result with the IP your server should have. E2E Cloud’s guide adds a useful split: if the site responds on the public IP but not on the domain name, the DNS record is wrong or stale. - Does the name resolve at all? FreeLock’s write-up on outages says DNS problems usually show up as timeouts, “domain not found” errors, or a page trying to sell you the domain. Pinging the failing domain and getting “Name or service not known” points straight at DNS.
Webfort lists the usual DNS culprits: an A record that is missing or still points at an old server (often after an unfinished host migration), nameservers changed without warning, and a CNAME loop or typo. It suggests comparing what a public checker such as dnschecker.org shows against what your hosting control panel says the record should be.
If you changed DNS recently, remember that propagation follows the record’s TTL. A short TTL set before a migration makes cutovers and rollbacks faster.
Layer 2: The server and the network path
If DNS is right, check whether the machine is reachable at all.
- Can you ping or SSH to the host?
- Is your provider reporting an incident? Check its status page before you spend an hour debugging a problem that is not yours.
- Is the disk full? A full disk quietly kills databases, log writers and PHP sessions.
- Is the box out of memory or pinned on CPU?
GridPane’s practical troubleshooting guide lists the same quick checks: services down in the monitoring panel, high swap or CPU, a domain that is misspelled or expired, DNS, a provider outage, and disk space.
Also confirm the ports. If port 443 is closed or a firewall rule changed, the server can be healthy and unreachable. A TCP check on the port tells you quickly.
Layer 3: The web server and its services
If the host is up but the site is not, a service has probably stopped. Check the web server, the application runtime and the database, and restart whichever is down. GridPane documents managed-stack restart commands such as gp ngx restart and gp mysql restart, and notes that its monitoring will try to restart a down service automatically first. On a plain Linux host you would use systemctl status and systemctl restart for the equivalent services.
Do not restart blindly and move on. If a service keeps dying, the cause is in the logs, and a restart only buys you minutes.
Layer 4: The application and the database
This is where the “server is up, site is broken” cases live. 1Byte’s guide to 500 errors explains that logs shorten incident time because they show the exact place of failure. It recommends three sets:
- Web server logs for request routing issues, permission errors and upstream failures.
- Application logs for exceptions, timeouts and failed calls to dependencies.
- Runtime logs for out-of-memory kills, worker crashes and process restarts.
Look at what changed. A deploy, a plugin update, a config edit or a migration in the last hours is the most likely cause. If the timing matches a release, rolling back is usually faster than debugging forward.
What HTTP error codes tell you
The status code is a free clue. UnderHost’s documentation maps common codes to causes:
| Code | What it usually means | Where to look first |
|---|---|---|
| 403 Forbidden | Wrong file permissions (typically 644 for files, 755 for directories) or an .htaccess problem | File permissions, .htaccess |
| 500 Internal Server Error | A PHP error or .htaccess syntax error | Application and error logs |
| 502 Bad Gateway | The upstream server is not responding | Application process, upstream service |
| 503 Service Unavailable | Server overloaded, in maintenance mode, or at a resource limit | Resource usage, maintenance flags |
| 521 / 522 | Cloudflare cannot reach your origin server | Origin server, firewall, ports |
Two habits make this table more useful. First, check the code from more than one place, because a CDN can serve one error while the origin returns another. Second, remember that a timeout is not a status code. If you get no response at all, go back to DNS, the network path and open ports.
Stabilize before you repair
If the cause is not obvious in the first few minutes, stop poking at the live system and contain the damage. Social Animal’s recovery playbook suggests this sequence:
- Take a snapshot of the broken state, so evidence and data are not lost.
- Put up a maintenance page that returns HTTP 503 with a Retry-After header, so visitors and search engines know it is temporary.
- Disable the broken component.
- If there is any chance of a compromise, change passwords in order: admin, database, SFTP or SSH, then the hosting panel.
The same source puts typical stabilization at 15 minutes to 2 hours, and says roughly 30% of the emergency cases it sees have no usable backup. Without a backup, it expects one to three days for a full rebuild, versus a few hours for a clean restore.
If you do have a backup, the restore path described by FreeLock is concrete: create a new VPS from the latest nightly snapshot, provision a disk from the data snapshot, configure mounts and restart, then move the reserved IP or update DNS to the new server.
The lesson is to test restores before you need them. A backup you have never restored is a hope, not a plan.
Verify recovery and tell your users
A page loading on your laptop is not recovery. Before you call it resolved:
- Load the site from a different network, as you did at the start.
- Check more than the home page: login, checkout, API endpoints and any page that touches the database.
- Confirm background work is running. Cron jobs and workers often stay broken after the web tier comes back.
- Watch for a repeat for at least one full check interval, ideally longer.
- Confirm DNS and certificates still look right, since emergency changes sometimes break them.
For communication, say three things plainly: what is affected, what you know so far, and when you will update next. Post it somewhere that does not depend on the system that is down. A status page hosted separately from your main infrastructure is the usual answer. Write the follow-up after recovery too: what happened, how long it lasted, and what you are changing. If you want a template for who gets told what and when, our guide on a downtime notification policy covers it.
Then measure the outage honestly. Detection time, response time and repair time are different numbers, and our breakdown of mean time to recovery shows how one outage can produce three different MTTRs.
How long is downtime supposed to last?
Readers often ask how long a site is normally down. It depends on the cause.
For planned maintenance, Techvertu’s estimates are 5 to 30 minutes for a small restart, 1 to 4 hours for routine OS or application patching, and several hours to a day or more for a major database upgrade or migration. A maintenance window is not necessarily the length of the outage itself.
For unplanned disruptions, San Jac ITS says most last from a few minutes to an hour, while rare catastrophic events can run for hours, days or weeks.
Those are ranges, not promises. What you can control is how fast you notice and how quickly you isolate the layer.
Our perspective on troubleshooting
Most downtime pain comes from two moments: the page that wakes you for nothing, and the 3 a.m. scramble to work out what broke. We built Uptime Beacon around both.
On the first, an incident should open only after several failures in a row, and on paid plans it is confirmed from a second location. A single dropped packet between one probe and your server is not an outage, and an engineer who is woken for it learns to distrust the pager.
On the second, the hardest part of troubleshooting is the first ten minutes: is it DNS, the network, the app, one region? That is a question about check history, so we let AI assistants read it. Over MCP, on every plan including Free, Claude, ChatGPT, Cursor, VS Code or Codex can read your monitors, incidents and check history and diagnose a failing monitor region by region. With “Allow changes” turned on for a team, it can also pause monitors, acknowledge incidents and start maintenance windows. Nothing can be deleted over MCP.
Our founders have spent more than 30 years combined running production in banking, fintech, telecom and SaaS. The lesson from that is simple: fewer, truer alerts beat more alerts, every time.
Aaditya Parashar
Catch the next outage before your users do
Troubleshooting is faster when you already know when it started and which regions saw it. Uptime Beacon checks HTTP endpoints, TCP ports and hosts from five regions: EU Central, EU North, US East, US West and Asia Pacific. It also covers heartbeat monitoring for cron jobs, certificate and domain expiry watches, and public status pages that do not depend on the dashboard.
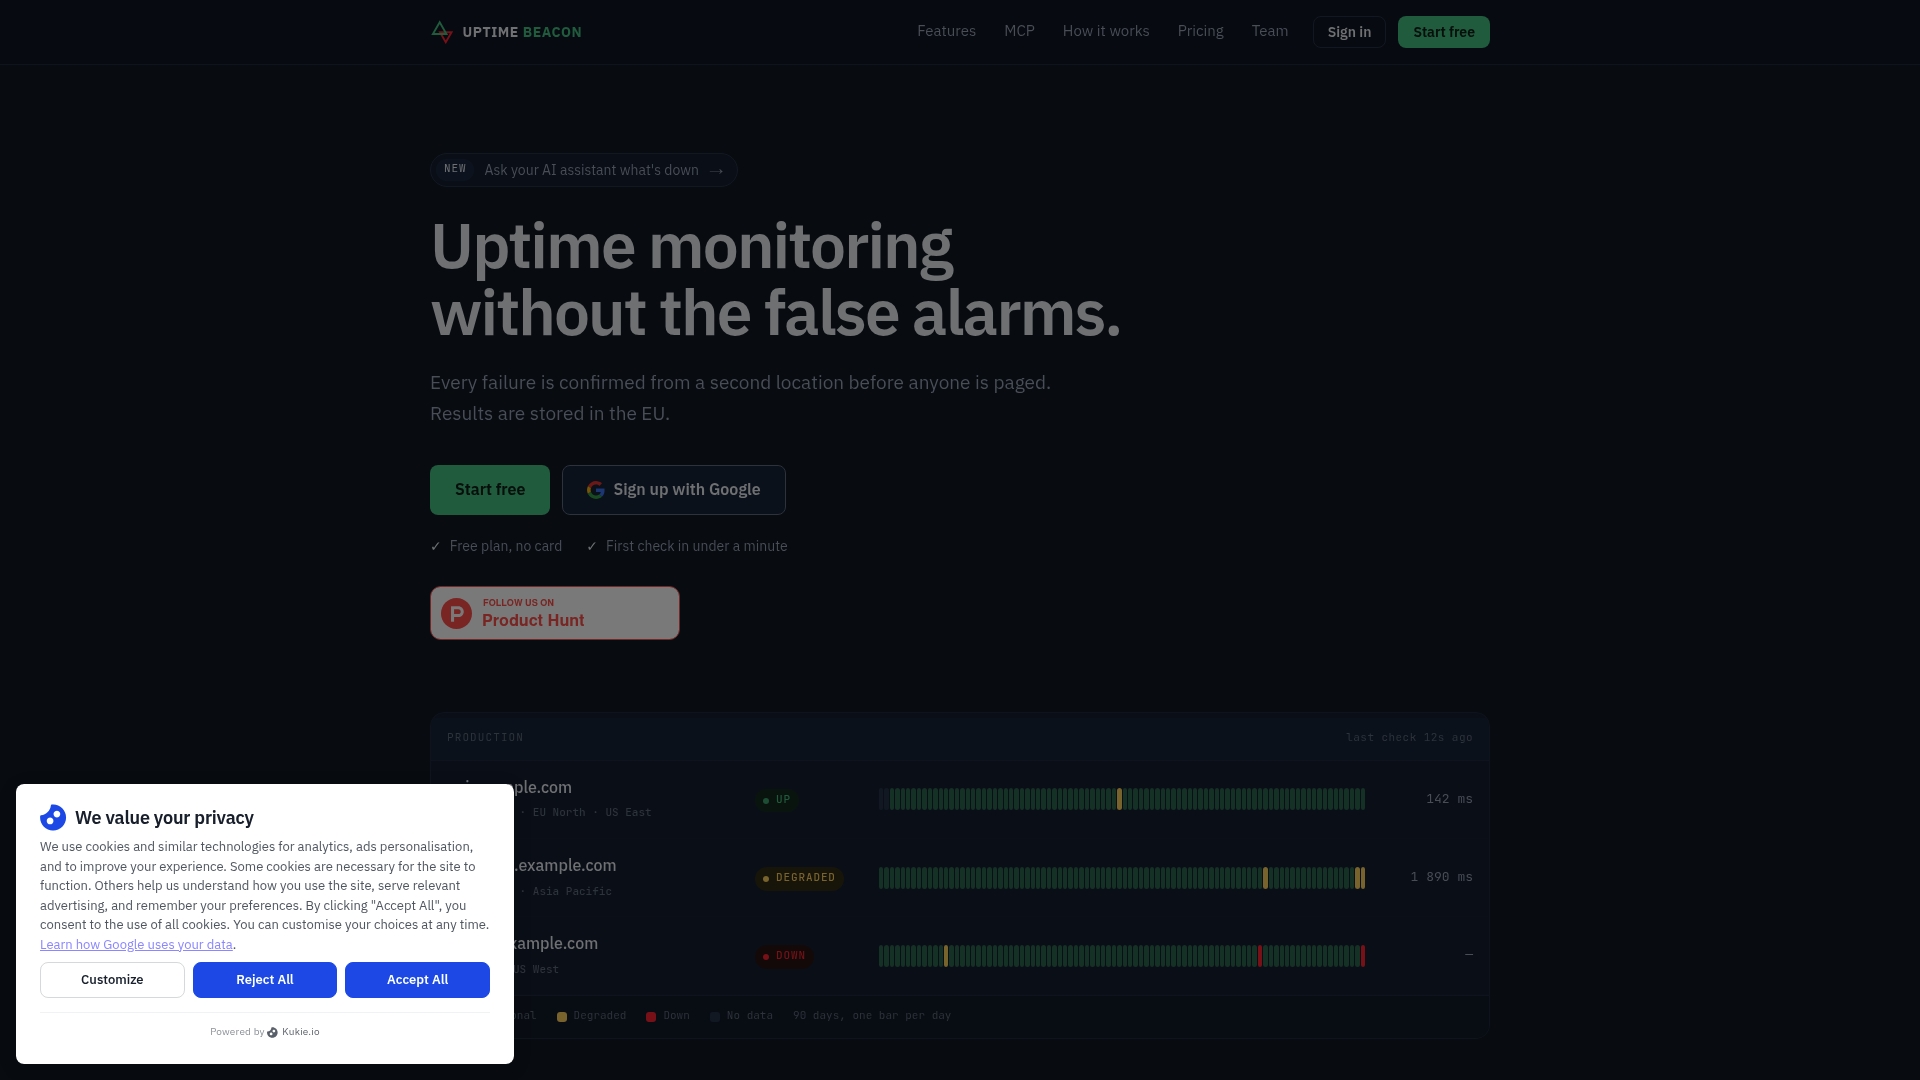
The Free plan costs €0 per month with no card: 5 monitors checked every 5 minutes from EU Central, one alert channel (email or Slack) and one status page. Paid plans start at €14.99 per month for Starter, then €39.99 for Pro and €89.99 for Business. Extra monitors are available as add-ons from €5 per month. See the plans and start free, or read how we handle API and cron monitoring for SaaS teams.
Prevent the next outage
Most repeat outages trace back to a short list of causes. Cloudflare’s guide to preventing downtime names hosting maintenance, overloaded servers, hardware faults, malicious attacks, programming bugs and expired domains. Its prevention list includes avoiding hosting plans with hard usage limits, failover servers in different physical locations, DDoS protection, testing production changes including edge cases, a registrar that warns about expiration, a CDN, and independent uptime monitoring.
Turn that into a routine:
- Watch expiry dates. Domains and certificates fail silently on a fixed date. Monitor them well ahead; our piece on domain expiry monitoring explains why starting early works.
- Monitor what users touch. A home page check misses a broken API. See API uptime monitoring for what to check and how to alert.
- Watch your background jobs. A cron job that stops running never throws an HTTP error. Heartbeat checks catch the silence, as covered in cron job monitoring.
- Write down your runbook. The layered order above, with your own commands and log locations, saves the first ten minutes.
- Set up monitoring that avoids noise. Our uptime monitoring guide walks through setup without false alarms, and our post on diagnosing website downtime goes deeper on finding the cause fast.
If your team has EU customers or GDPR obligations, ask any monitoring vendor where check results are stored and processed. With Uptime Beacon, every result is stored on a control plane and database in the EU, and the service is operated by Wealth Beacon OÜ in Estonia.
FAQ
How do I troubleshoot a website that is not loading?
First test from another network, such as a phone on cellular data, to rule out your own connection. Then check DNS, server reachability, the web server, and the application and database in that order. Use the HTTP status code and the logs to pinpoint the failing layer.
What should I check first when my web server is down?
Check whether the problem is local or global, then whether your host reports an incident. Next confirm DNS resolves to the right IP with dig or nslookup. After that, look at resource usage, disk space and the error logs.
Why does my site work for some people but not others?
Common reasons are regional edges, a DNS change still propagating, a routing problem at one ISP, or a resolver that filters the domain. Testing from several networks and regions shows the pattern. Multi-region monitoring makes this visible without asking people to test for you.
How long is a website usually down for maintenance?
A small restart can take 5 to 30 minutes, routine patching 1 to 4 hours, and a major database upgrade or migration several hours to a day or more. Announce the window and use a 503 maintenance page so visitors and search engines know it is temporary.
Can an AI assistant help diagnose downtime?
Yes, if it can read your monitoring data. With Uptime Beacon’s MCP server, an assistant such as Claude or Cursor can read monitors, incidents and check history and compare a failing monitor region by region. You sign in without an API key, and it is available on every plan, Free included.
Sources
- NetDebug: Is the Website Down, or Just You?
- Webfort: Website Down Checklist for Small Businesses
- E2E Cloud: Site Down documentation
- FreeLock: Website Availability, handling an outage
- GridPane: Sites are Down! Part 2, Practical Troubleshooting
- 1Byte: 500 Internal Server Error, Causes and Fixes
- UnderHost: My website is down, what to check first
- Social Animal: Website Down? Emergency Recovery Playbook
- Techvertu: How Long Does Server Maintenance Last?
- San Jac ITS: Service Disruptions and Outages
- Cloudflare: How to keep a website from going down


