To diagnose website downtime, work from the outside in. First decide whether the site is down for everyone or only for you. Then find the failing layer: DNS, TLS, the network path, the web server or the application behind it. Then read the HTTP status code and the logs for the cause. Most outages fall into one of those layers, and a fixed order of checks gets you to the right one in minutes instead of an hour of guessing.
This guide gives you that order, what each symptom usually means, and how to set up monitoring so the next outage shows up with a diagnosis attached, not just an alarm at 3 a.m.
TL;DR
- Rule out your own network first: load the site on mobile data with Wi-Fi off, or run a request from a different connection.
- Locate the layer in order: DNS, then TLS, then connection, then HTTP status, then application and dependencies.
- Status codes narrow the cause: 5xx points at the server side, and 502, 503 and 504 point at gateways, overload or timeouts.
- Single-location checks produce false alarms. Alert only after repeated failures confirmed from a second region.
- Monitoring that checks from several regions shows whether an outage is global or regional, which is half the diagnosis.
Table of Contents
- Step 1: Is it down for everyone or just you?
- Step 2: Find the failing layer
- Step 3: Read the status code
- Step 4: Check the application and its dependencies
- Regional outages: why one location is not enough
- How to cut false alarms without missing real outages
- What we think: a diagnosis should arrive with the alert
- Build a setup that catches the next outage
- Choosing a downtime detection tool
- Try it on the Free plan
- FAQ
- Sources
Step 1: Is it down for everyone or just you?
Before you touch a server, rule out your own side. A failed page load in your browser can be a stale DNS cache, a VPN, a corporate firewall or your ISP, and none of those mean your site is down.
The quickest test is a different network. Turning off Wi-Fi on your phone and loading the page over mobile data changes your IP address, route, DNS resolver and ISP all at once, as this troubleshooting guide explains. If the site loads there, the problem is local to your network or device.
If it fails on mobile data too, repeat the request from a server you control:
curl -sI https://example.com
The -I flag fetches only the headers, so you see the status code and the server’s response headers without rendering anything. A 200 OK from a server in another data center while your browser fails points back at something local, such as your DNS cache or a proxy.
One caveat matters later: a check from a single location only shows that the site answered, or did not, from that location and through that location’s resolver. It does not prove the site works for everyone. That is why several regions matter, and we come back to it below.

Step 2: Find the failing layer
Every “site is down” symptom is a failure in one layer of the request path. Walk the layers in the order a browser does, and stop at the first one that breaks.
| Layer | What to check | Typical symptom |
|---|---|---|
| DNS | Does the domain resolve to the right IP? | “Server not found”, NXDOMAIN, wrong IP |
| Network | Can you open a TCP connection to port 443 or 80? | Timeout, connection refused |
| TLS | Is the certificate valid, unexpired and complete? | Certificate warnings, handshake errors |
| HTTP | What status code and headers come back? | 4xx or 5xx responses |
| Application | Does the page or API return the right content? | 200 with an error body, blank page, slow responses |
DNS
Run dig example.com or nslookup example.com and check that an address comes back, and that it is the address you expect. If nothing resolves, suspect an expired domain registration, a deleted zone or a nameserver outage. If it resolves to an old IP, a recent change has not propagated or was made wrong. Check the registration expiry date before anything more elaborate: an expired domain is an embarrassing outage and an entirely avoidable one.
Connection
If DNS is fine, test the port: nc -vz example.com 443 or curl -v https://example.com. “Connection refused” means nothing is listening, so the web server process is down or bound to the wrong interface. A timeout usually means a firewall, a security group, a dead host or a network path problem.
TLS
With the connection open, the handshake comes next. An expired certificate, a missing intermediate certificate, or a protocol mismatch will make browsers refuse the page even though the server is running. curl -v prints the certificate chain and the failure point. We cover the causes in detail in our guide to TLS handshake failures.
HTTP and the application
Once TLS works, the status code is your best clue, covered next. If the code is a clean 200 but users still complain, the failure is inside the application: an error rendered with a success code, a broken login, or a dependency that hangs.
Step 3: Read the status code
The HTTP status is the server telling you what it thinks happened. MDN groups them in classes: 4xx for client errors and 5xx for server errors, all defined by RFC 9110 as listed on MDN.
| Code | What it usually means | First thing to check |
|---|---|---|
| 404 | The resource was not found | A deploy that moved or removed the route, a bad rewrite rule |
| 500 | A server-side problem | Application error logs from the failing request |
| 502 Bad Gateway | A gateway got an invalid response from the server behind it | Is the app process running? Did it crash or restart? |
| 503 Service Unavailable | The server is not ready to handle the request, often due to maintenance or overload | Load, connection limits, a maintenance flag left on |
| 504 Gateway Timeout | A gateway did not get a response in time | Slow database queries, a hung upstream, timeout settings |
The 404, 500 and 503 descriptions match MDN’s guide to checking that a site works, and the 502 to 504 definitions come from the MDN status code reference.
If you sit behind a CDN, look at who generated the error page. A branded Cloudflare 5xx page strongly suggests the origin server behind Cloudflare is the problem, not the CDN itself. That saves you from debugging the wrong tier.
Step 4: Check the application and its dependencies
A 200 does not mean healthy. Many real incidents are applications that answer but cannot do their job, because a dependency is failing. Work through these:
- Recent changes. What deployed, migrated or changed in configuration in the last hour? Most outages follow a change, so start there.
- Resources. CPU, memory, disk space and open file descriptors. A full disk takes down databases and log writers quietly.
- Database. Connection pool exhaustion and long-running queries cause the 504s that look like a web server problem.
- Third-party services. Payment providers, auth providers, email APIs and object storage. If your page waits on one that is down, you are down too.
- Background workers. Queues backing up or a cron job that silently stopped can break features without any HTTP error.
- Certificates and domains. Expiry is a clock, not a surprise. It still takes sites down every year.
For APIs, a dedicated health endpoint that checks the database and critical dependencies makes this step much quicker. See our notes on API health checks and what to check and how to alert for API uptime.
Regional outages: why one location is not enough
Some outages are partial. A routing problem, a CDN edge issue or a DNS provider fault can leave your site fine in Frankfurt and dead in Virginia. A monitor in one place tells you one of two things, and you cannot know which: your site is down, or the path from that monitor to your site is bad.
Checking from several regions gives you the pattern straight away:
- Failing everywhere: the origin, the application or the domain itself is the problem.
- Failing in one region: a network path, CDN edge or regional DNS issue.
- Failing intermittently in one place: probably a blip that should not wake anyone.
Uptime Beacon checks HTTP endpoints, TCP ports and hosts from five regions: EU Central, EU North, US East, US West and Asia Pacific. That regional split is the data you need for the “everyone or just some” question.
How to cut false alarms without missing real outages
A monitor that cries wolf trains people to ignore it. Google’s SRE guidance is that alerts should be urgent, actionable and user-visible, with high signal and low noise, because frequent false alerts lead to pager burnout and missed real incidents.
Three habits fix most of the noise:
- Require several failures in a row. One failed request is rarely an outage. Three consecutive failures over a few minutes usually is.
- Confirm from a second location. If one region says down and another says up, you have a path problem or a blip, not a confirmed incident.
- Alert on user-visible symptoms. A failing login or checkout matters more than a CPU spike nobody feels.
Our uptime monitoring guide walks through the thresholds, and the piece on SaaS uptime monitoring explains how to page only for real failures.
What we think: a diagnosis should arrive with the alert
We built Uptime Beacon around one idea: the page you get at night should already be worth waking up for. An incident opens only after several failures in a row, confirmed from a second location on paid plans, so a network blip between one probe and your server does not become a 3 a.m. call. Our founders have more than 30 years of combined experience running production in banking, fintech, telecom and SaaS, and the lesson from all of it is the same: most pager pain comes from noise, not from outages.

The second half of diagnosis is the slow part, and it is where we think assistants help. Every plan, Free included, includes an MCP server. You connect Claude, ChatGPT, Cursor, VS Code, Codex or any MCP client to https://app.uptimebeacon.eu/mcp, sign in, and there is no API key to manage. The assistant can read your monitors, incidents and check history, and diagnose a failing monitor region by region. You ask “why is checkout failing?” and get an answer built from the actual check data, not a guess.
If you turn on “Allow changes” for a team, the assistant can also create, pause and resume monitors, acknowledge incidents and start maintenance windows. Nothing can be deleted over MCP. That boundary is deliberate: an assistant should help you work through an incident, and it should never be able to remove the evidence.
— Aaditya Parashar
Build a setup that catches the next outage
Diagnosis is faster when monitoring is already in place. A reasonable baseline for a production site:
- An HTTP monitor on a real page or health endpoint, not just the homepage, with an expected status code and content check where possible.
- TCP monitors for services that are not HTTP, such as a database port or mail server.
- Certificate and domain expiry watches, so renewals never become incidents.
- Heartbeat monitoring for cron jobs and workers. The job pings when it runs, and silence raises the alarm. This catches the failures that never produce an HTTP error.
- A status page that does not depend on your dashboard, so customers can see what is happening even when your own stack is down.
- A written notification policy, so everyone knows who is told what and when. Our guide to a downtime notification policy is a starting point.
If you promise uptime to customers, know what the number means. Three nines allows a specific amount of downtime a month, and we break it down in 99.9% uptime meaning, with the arithmetic in the SLA uptime formula. Teams running APIs and scheduled jobs will find the SaaS use case page relevant, and shops can look at monitoring for online stores.
Choosing a downtime detection tool
When you compare tools, ignore the feature count and test these:
| Question | Why it matters |
|---|---|
| Where do checks run, and how many regions? | One location cannot tell a global outage from a path problem. |
| How does it decide an incident is real? | Look for consecutive failures and second-location confirmation. |
| Which protocols? | HTTP alone misses ports, hosts, cron jobs and certificates. |
| Which alert channels? | Email, Slack and webhooks cover most teams. |
| Does the status page survive an outage? | A status page on the same stack fails with it. |
| Where is the data stored? | Matters for teams with GDPR obligations. |
| What does it cost as you grow? | Check monitor limits and add-on pricing, not only the entry price. |
On data location: if you process personal data of people in the EU, GDPR Chapter V puts the due diligence on you, as the EU Cloud Code of Conduct notes for customers and providers transferring data outside the EEA. Ask a vendor where its control plane and database live. We store every result on a control plane and database in the EU, and our piece on EU data residency lists six questions to ask beyond location. Uptime Beacon is operated by Wealth Beacon OÜ in Estonia.
Try it on the Free plan
You can start without a card. The Free plan includes 5 monitors checking every 5 minutes from EU Central, one alert channel (email or Slack), one status page, and the MCP server, so you can ask an assistant to diagnose a failing monitor from day one.
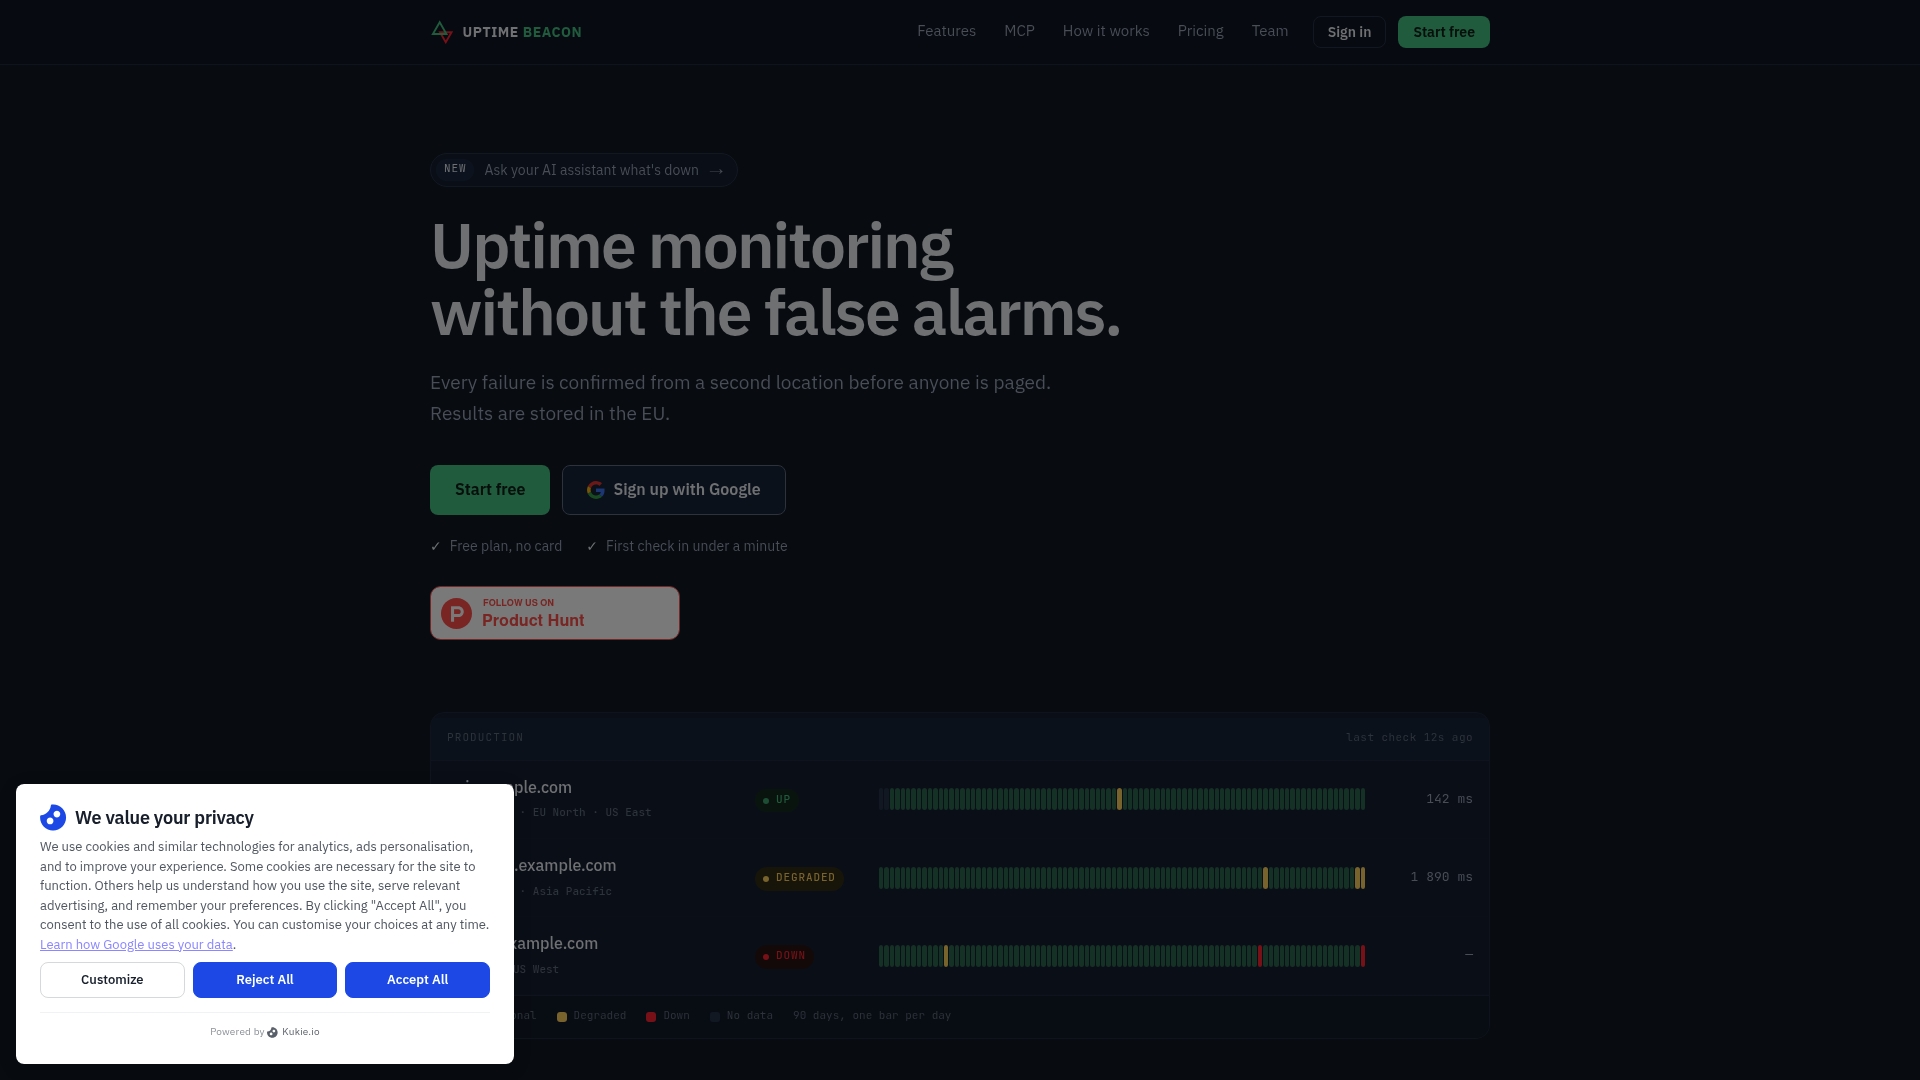
When you need confirmation from a second region, maintenance windows and more monitors, paid plans start at 14.99 EUR per month for Starter, 39.99 EUR per month for Pro and 89.99 EUR per month for Business. Extra capacity is available as add-ons, for example 10 more monitors on Starter for 5 EUR per month. Enterprise pricing is not published. See the plans on our site.
FAQ
How do I know if my website is down for everyone?
Load it on a different network, such as your phone on mobile data, and run a curl -I request from a separate server. If both succeed, the problem is on your side. Monitoring from several regions answers it continuously, since you can see which locations fail.
Why is my website down when the server looks fine?
The failure is often in a layer you have not checked: an expired domain, a DNS change, an expired or incomplete TLS certificate, a gateway that cannot reach the application, or a dependency such as the database. Work through DNS, connection, TLS, status code and application in order.
What does a 502, 503 or 504 error mean?
A 502 means a gateway got an invalid response from the server behind it. A 503 means the server is not ready to handle the request, commonly because of maintenance or overload. A 504 means a gateway did not get a response in time. All three point you at the layer behind the web front end, as the MDN reference describes.
How can I stop false downtime alerts?
Require several failed checks in a row and confirm from a second location before opening an incident. Alert on conditions that are urgent and user-visible. This keeps the pager meaningful so real incidents get attention.
Sources
- HTTP response status codes, MDN Web Docs
- How do you make sure your website works properly?, MDN Web Docs
- Is the Website Down, or Just You? Four Checks That Settle It
- Are You Down? A Guide to Determining What Kind of Down a Site Is
- Monitoring Distributed Systems, Google SRE Book
- EU Cloud Code of Conduct, EDPB


