The best synthetic monitoring tool is the one that matches the kind of check you need and pages you only when something is really broken. For endpoint, API, port and cron checks from several regions, Uptime Beacon is our pick, and it has a free plan. For scripted browser journeys, the established platforms below (Checkly, Datadog, Grafana Cloud, Catchpoint and others) are built around that job. This guide sorts the field by what each tool does, then shows how to decide.
TL;DR
- “Synthetic monitoring” covers several techniques: endpoint probes, recorded flows and coded browser journeys. Pick the technique first, then the vendor.
- Alert reliability decides whether you keep a tool. Look for consecutive-failure rules, multi-location confirmation, maintenance windows and routing to Slack or webhooks.
- Uptime Beacon opens an incident only after several failures in a row, confirmed from a second location on paid plans. It starts at 0 EUR per month with no card.
- Open-source tools are free to license, but you run the machines, storage and upgrades yourself.
- If you have GDPR or EU residency requirements, ask every vendor where results and control plane data live.
Table of Contents
- What synthetic monitoring actually means
- Synthetic monitoring vs. real user monitoring
- What to look for before you compare vendors
- The best synthetic monitoring tools compared
- Where Uptime Beacon fits
- AI assistants over MCP
- Open-source options and what you operate yourself
- EU data residency and GDPR
- How to choose: three quick scenarios
- Our perspective
- Try Uptime Beacon free
- FAQ
- Sources
What synthetic monitoring actually means
Synthetic monitoring is scheduled automation that probes your production system the way a user or client would. USENIX describes it as probing health endpoints or exercising API calls on a schedule and validating the responses, with browser synthetics replaying recorded or coded user workflows.
That gives you three practical families:
- Endpoint and API probes. An HTTP request, a TCP connection or a host check, repeated every minute or few minutes, with assertions on status, body or latency.
- Recorded flows. A tool records a click path (log in, add to cart) and replays it.
- Coded journeys. Playwright or Selenium scripts that run on a schedule from managed locations.
The same label sits on all three, but they are not equivalent features across vendors. A tool that does the first family brilliantly may not do the third, and the price difference between them is large. Decide which failures you need to catch before you compare feature grids.
Synthetic monitoring vs. real user monitoring
Synthetic checks and real user monitoring (RUM) answer different questions. MDN notes that synthetic monitoring suits regression testing and short-term development feedback, while RUM is better for long-term trends and for real performance across devices, browsers, networks and geographies.
In practice:
- Use synthetic checks when you need to know at 3 a.m. whether the API answers, the certificate is valid and the cron job ran. Nobody has to be using the product for the probe to tell you.
- Use RUM when the question is what your users experienced on slow phones in a specific country.
- Use both once you have a product with traffic. Synthetic tells you something is down now; RUM tells you who felt it.
What to look for before you compare vendors
An independent comparison of synthetic monitoring tools recommends checking retries, location quorum, maintenance windows, suppression and routing to Slack, PagerDuty, webhooks or incident tools when you evaluate alert reliability. We agree with that list, and we would add a few criteria of our own.
| Criterion | Why it matters | What to ask |
|---|---|---|
| Test types | Probes, recorded flows and coded journeys are priced and operated differently | Which family do I need today, and in a year? |
| Failure confirmation | A single failed request from one region is often a network blip | Does an incident need consecutive failures and a second location? |
| Locations | Regional problems only show from regional probes | How many regions, and can I see results per region? |
| Alert routing | Alerts must reach where the on-call engineer already is | Email, Slack, webhooks, paging tools? |
| Maintenance windows | Planned work should not page anyone | Can I suppress alerts for a window? |
| Pricing model | Per monitor, per run or usage-based bills grow differently | What does 3x the checks cost? |
| Data location | Matters for GDPR and client contracts | Where are results and the control plane stored? |
| Operability | Self-hosting shifts work to you | Who patches and watches the monitor? |
The best synthetic monitoring tools compared
The table sorts the tools by what they are best at. Browser-journey support across Checkly, Datadog, New Relic, Catchpoint, Grafana Cloud, Uptrends, Pingdom and Better Stack is reported by the same independent comparison, which also finds that alert-routing strengths differ by ecosystem and ownership model. Check each vendor’s own pricing page for current figures, because plans change.
| Tool | Best for | Notes |
|---|---|---|
| Uptime Beacon | On-call engineers and small teams who want fewer false alarms | HTTP, TCP and host checks from five regions, heartbeat monitoring for cron jobs, certificate and domain expiry watches, status pages, MCP access for AI assistants, EU storage |
| Checkly | Teams that write Playwright tests and define monitors in code | Browser-journey monitoring |
| Datadog | Teams already on Datadog for metrics and traces | Code-free API and browser tests inside a wider platform |
| Grafana Cloud | Teams already using Grafana dashboards | Usage-priced, with an always-on allowance |
| Catchpoint | Large enterprises with network-level needs | Per-unit pricing is published on its parent company’s page |
| New Relic, Uptrends, Pingdom, Better Stack | Teams that want monitoring bundled with their existing stack | Browser-journey monitoring supported |
| Sematext | Per-monitor billing | Billing is per monitor |
| sitespeed.io | Teams that want to self-operate | MIT-licensed; you pay for machines and storage |
The usage and billing descriptions for Grafana Cloud, Catchpoint, Sematext and sitespeed.io come from a November 2026 software comparison.
Where Uptime Beacon fits
We built Uptime Beacon for people who carry the pager. It checks HTTP endpoints, TCP ports and hosts from five regions: EU Central, EU North, US East, US West and Asia Pacific. Our core design choice is about alerts: an incident opens only after several failures in a row, confirmed from a second location on paid plans. The goal is that an on-call engineer is not woken by a network blip.
The rest of the product follows the same working-engineer logic:
- Heartbeat monitoring for cron jobs and background workers. See our guide to cron job monitoring with two-location confirmation.
- Certificate and domain expiry watches, so a lapsed certificate does not become an outage.
- Status pages that don’t depend on the dashboard, so they stay reachable during an incident.
- Maintenance windows on Starter and above.
- Email, Slack and webhook alerts.
If your synthetic needs are mostly APIs, our posts on API uptime monitoring, API health check design and API latency monitoring show what to assert and how to alert on it.
Pricing as published on our site
The prices below were read from our site on 8 October 2026. Check the pricing page for the current list.
| Plan | Price |
|---|---|
| Free | 0 EUR per month |
| Starter | 14.99 EUR per month |
| Pro | 39.99 EUR per month |
| Business | 89.99 EUR per month |
| Enterprise | No published price |
Add-ons start from 5 EUR per month: 10 more monitors on Starter cost 5 EUR per month, 50 more on Pro cost 10 EUR per month, 100 more on Business cost 15 EUR per month, and 10 more certificate or domain expiry watches cost 5 EUR per month.
The Free plan needs no card and includes 5 monitors checked every 5 minutes from EU Central, one alert channel (email or Slack) and one status page.
AI assistants over MCP
Our second differentiator is that AI assistants can work with your monitoring directly. On every plan, Free included, you connect Claude, ChatGPT, Cursor, VS Code, Codex or any MCP client to https://app.uptimebeacon.eu/mcp and sign in. There is no API key.
The assistant can read monitors, incidents and check history, and it can diagnose a failing monitor region by region. If you turn on “Allow changes” for a team, it can also create, pause and resume monitors, acknowledge incidents and start maintenance windows. Nothing can be deleted over MCP.
For developers who already live in an AI coding assistant, that means asking “why is the payments endpoint failing from US West?” in the editor instead of opening three dashboards. We go deeper in AI incident response for on-call teams.
Open-source options and what you operate yourself
If you prefer to run your own, the open-source field includes Uptime Kuma, Gatus, OneUptime, Prometheus Blackbox Exporter, OpenStatus, Zabbix, Kener, Healthchecks.io, Monika, Icinga 2 and Statping-ng. Blackbox Exporter is typically paired with Prometheus, Grafana and Alertmanager, so you assemble a stack rather than install one product.
The license is free, but the work is not. You provide the servers, storage, upgrades and the probes themselves. A self-hosted probe that runs in one location will also tell you little about regional failures. The question to ask is who monitors the monitor at 3 a.m. For many small teams that cost exceeds a low-priced hosted plan, which is why a free hosted tier is a sensible starting point.
EU data residency and GDPR
For EU companies, where monitoring results are stored is a real procurement question. Monitoring data includes URLs, response details and incident history, and your customers’ contracts may ask where it sits. When you compare vendors, ask three things: where the control plane runs, where the database lives, and where check results are stored. Then ask whether the answers are the same on every plan.
On our side, every result is stored on a control plane and database in the EU. Uptime Beacon is operated by Wealth Beacon OÜ in Estonia. Probes run from five regions, including US East, US West and Asia Pacific, so you can see how a service looks from where your users are. For the full vendor-by-vendor picture, read each provider’s own data processing and hosting documentation.

How to choose: three quick scenarios
You are a solo developer or startup founder with a handful of services. You need uptime, certificate expiry and a status page without a bill. Start on the Free plan: 5 monitors, one alert channel, one status page.
You run a small SaaS team with an on-call rotation. Your main enemy is alert fatigue. Prioritize failure confirmation, maintenance windows and Slack or webhook routing. Our SaaS uptime monitoring guide and API and cron monitoring for SaaS teams cover that setup.
You maintain client sites as an agency or freelancer. You need many monitors, clear incident history to show clients, and public status pages. Plan on add-on monitors as your client list grows, and read our uptime monitoring setup guide first.

If you need heavy scripted browser journeys across a large application, pair your probes with one of the browser-journey platforms in the table and keep endpoint checks where they are cheapest and quietest.
Our perspective
Most monitoring tools fail in the same way: they are right that something failed once, and wrong that anyone should be awake for it. After decades of running production in banking, fintech, telecom and SaaS, our founders learned that the pager is the product. If it cries wolf, engineers mute it, and then a real outage gets through.
That is why Uptime Beacon opens an incident only after several failures in a row, confirmed from a second location on paid plans. We would rather be certain than fast by a few seconds.
We also think monitoring should meet engineers where they work now. Putting MCP on every plan, Free included, means any developer with an AI assistant can ask what is failing and where, region by region, without wiring up an API key. Turn on “Allow changes” and the assistant can acknowledge incidents or start a maintenance window, while deletion stays off the table.
Keeping results in the EU is the last point on our list, not the first, but for many teams it is the one that closes the contract.
Aaditya Parashar
Try Uptime Beacon free
If your checks are endpoints, APIs, ports, cron jobs and certificates, you can have real monitoring running today. The Free plan gives you 5 monitors every 5 minutes from EU Central, one alert channel and one status page, with no card required. Paid plans start at 14.99 EUR per month and add second-location confirmation and maintenance windows.
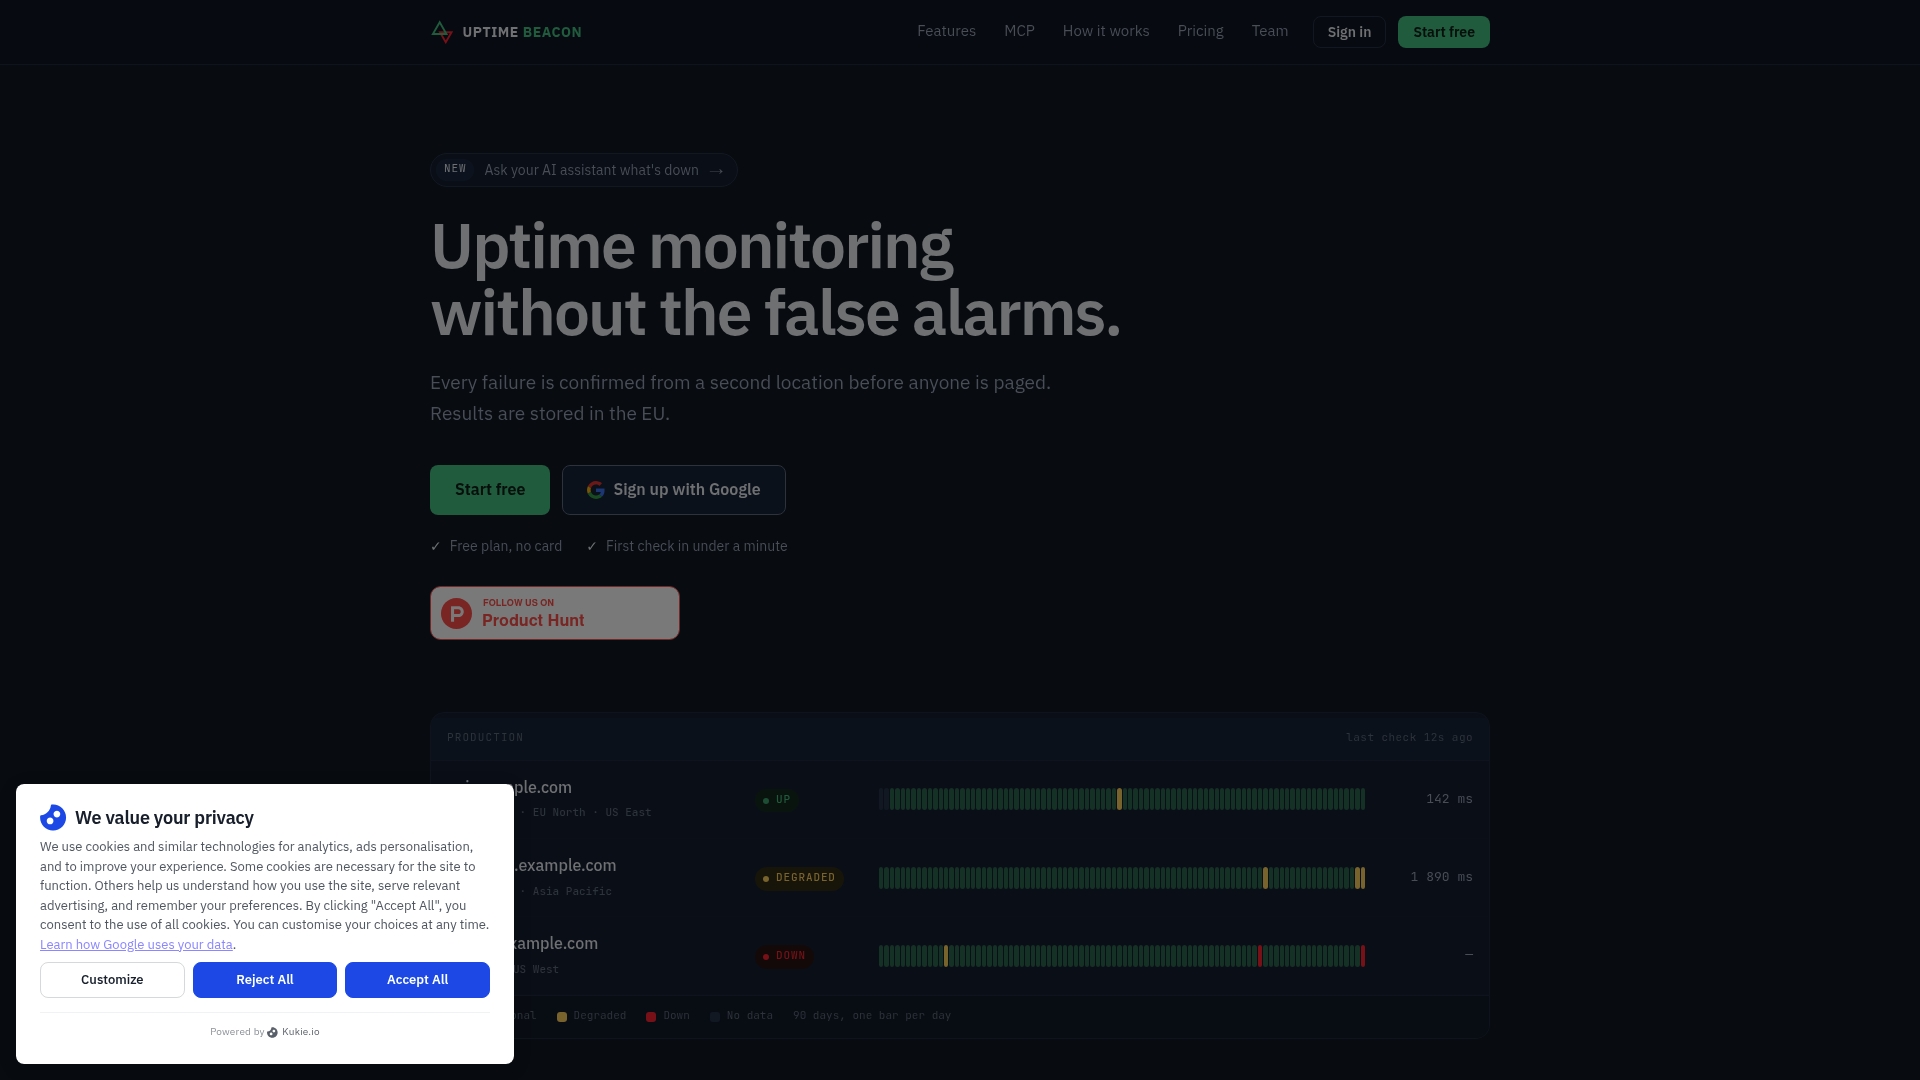
See the plans and start free and connect your AI assistant to the MCP server in minutes.
FAQ
What is the difference between synthetic monitoring and real user monitoring?
Synthetic monitoring runs scheduled, scripted checks against your system, so it works even with zero traffic. Real user monitoring records what actual visitors experience across devices, browsers and networks. MDN describes synthetic as best for regression testing and RUM for long-term trends.
Which synthetic monitoring tool is best for a small team?
It depends on the checks you need. For endpoint, API, port and cron monitoring with few false alarms, Uptime Beacon fits small teams and starts free. For coded browser journeys, look at platforms built around Playwright-style tests.
Are there free synthetic monitoring tools?
Yes. Hosted options include the Uptime Beacon Free plan (5 monitors, 5-minute checks, one status page). Open-source tools such as Uptime Kuma or Gatus have no license fee, but you host and maintain them yourself.
How do I reduce false alarms from synthetic monitors?
Require several consecutive failures before an incident opens, and confirm from a second location. Add maintenance windows for planned work, and route alerts to a channel your on-call engineer actually watches. Uptime Beacon applies the first rule by design, with second-location confirmation on paid plans.
Sources
- Synthetic Monitoring & End-to-End Testing: Two Sides of the Same Coin (USENIX)
- Selecting Synthetic Monitoring Tools for API Checks, Browser Journeys and Alert Routing (Test Automation Tools)
- Best Synthetic Monitoring Software in 2026 (The Knowledge Engineers)
- Performance Monitoring: RUM vs. synthetic monitoring (MDN)


