The best API monitoring tool is the one that matches how deep you need to check, tells you about real failures only, and fits your team’s size and data rules. For simple uptime and correctness checks with few false alarms, Uptime Beacon is our pick. For deep scripted workflows, look at Checkly or Postman. For full-stack observability, look at Datadog or New Relic. For free self-hosting, look at Uptime Kuma or Prometheus with Grafana.
Below we sort the field by category, compare the tools on the criteria that matter at 3 a.m., and show where each one fits.
TL;DR
- API monitoring comes in layers: uptime checks, assertion-based checks, multi-step workflows, production telemetry and tracing. Most small teams need the first two done well.
- False alarms are the cost most comparisons skip. Look for retries, multi-region confirmation and alert grouping before you look at the feature grid.
- Uptime Beacon opens an incident only after several failures in a row, confirmed from a second location on paid plans. It also includes an MCP server on every plan, Free included.
- Self-hosted tools such as Uptime Kuma and Prometheus with Grafana cost no license fee, but you run the infrastructure yourself.
- If you must keep monitoring data in the EU, check where results are stored, not just where the vendor is headquartered.
Table of Contents
- What API monitoring actually covers
- How we compare the tools
- The best API monitoring tools, by category
- Side-by-side comparison
- Why false alarms deserve their own column
- Which tool for which team
- Switching from another tool
- Our perspective
- Try Uptime Beacon free
- FAQ
- Sources
What API monitoring actually covers
API monitoring is continuous observation of an API’s behavior: is it up, is it fast, and is it returning the right thing. The UK’s National Cyber Security Centre draws a useful line: monitoring is real-time observation of performance and security indicators, while logging is the retrospective audit trail used for forensics and incident response. You need both, and neither replaces the other.
For external, synthetic checks, CloudSEK describes three core questions: does the endpoint answer, does it answer within an acceptable latency, and does the response have the expected structure and values. Those are availability, performance and correctness.
The tool market splits into categories along those lines. CodeWords lists simple uptime checks, assertion-based validation, scripted multi-step workflows, production-traffic monitoring and tracing. Uptime checks catch outages, synthetic checks catch wrong responses, production monitoring catches problems at real scale, and tracing explains why. The practical architecture is layered, and you rarely need every layer on day one.
If you want the hands-on version of the first layers, our guides on API uptime monitoring, API latency monitoring and API health check design go through what to check and how to alert.
How we compare the tools
Feature grids look alike. These are the criteria that separate tools once the pager goes off:
- Check depth. Plain HTTP status, assertions on the body and headers, or scripted multi-step flows.
- Regions. Whether checks run from several locations and whether more than one location must agree before you are alerted.
- False-alarm controls. Retries, confirmation, deduplication, suppression and routing to the right owner.
- Integrations and alert channels. Email, Slack, webhooks, on-call tools.
- Setup effort. Minutes, hours or a project.
- Data location and terms. Where results are stored, and what the vendor commits to.
- Price and limits. Check the vendor’s own pricing page, because plans change often.
The last two matter more than most listicles admit. A guide to this topic from Thunderbit puts the selection advice well: check required depth, regions, integrations, pricing and data terms, then compare false-alarm controls such as retries, multi-region confirmation, deduplication, suppression and ownership routing.
The best API monitoring tools, by category
Uptime Beacon: fewer false alarms, AI assistants included
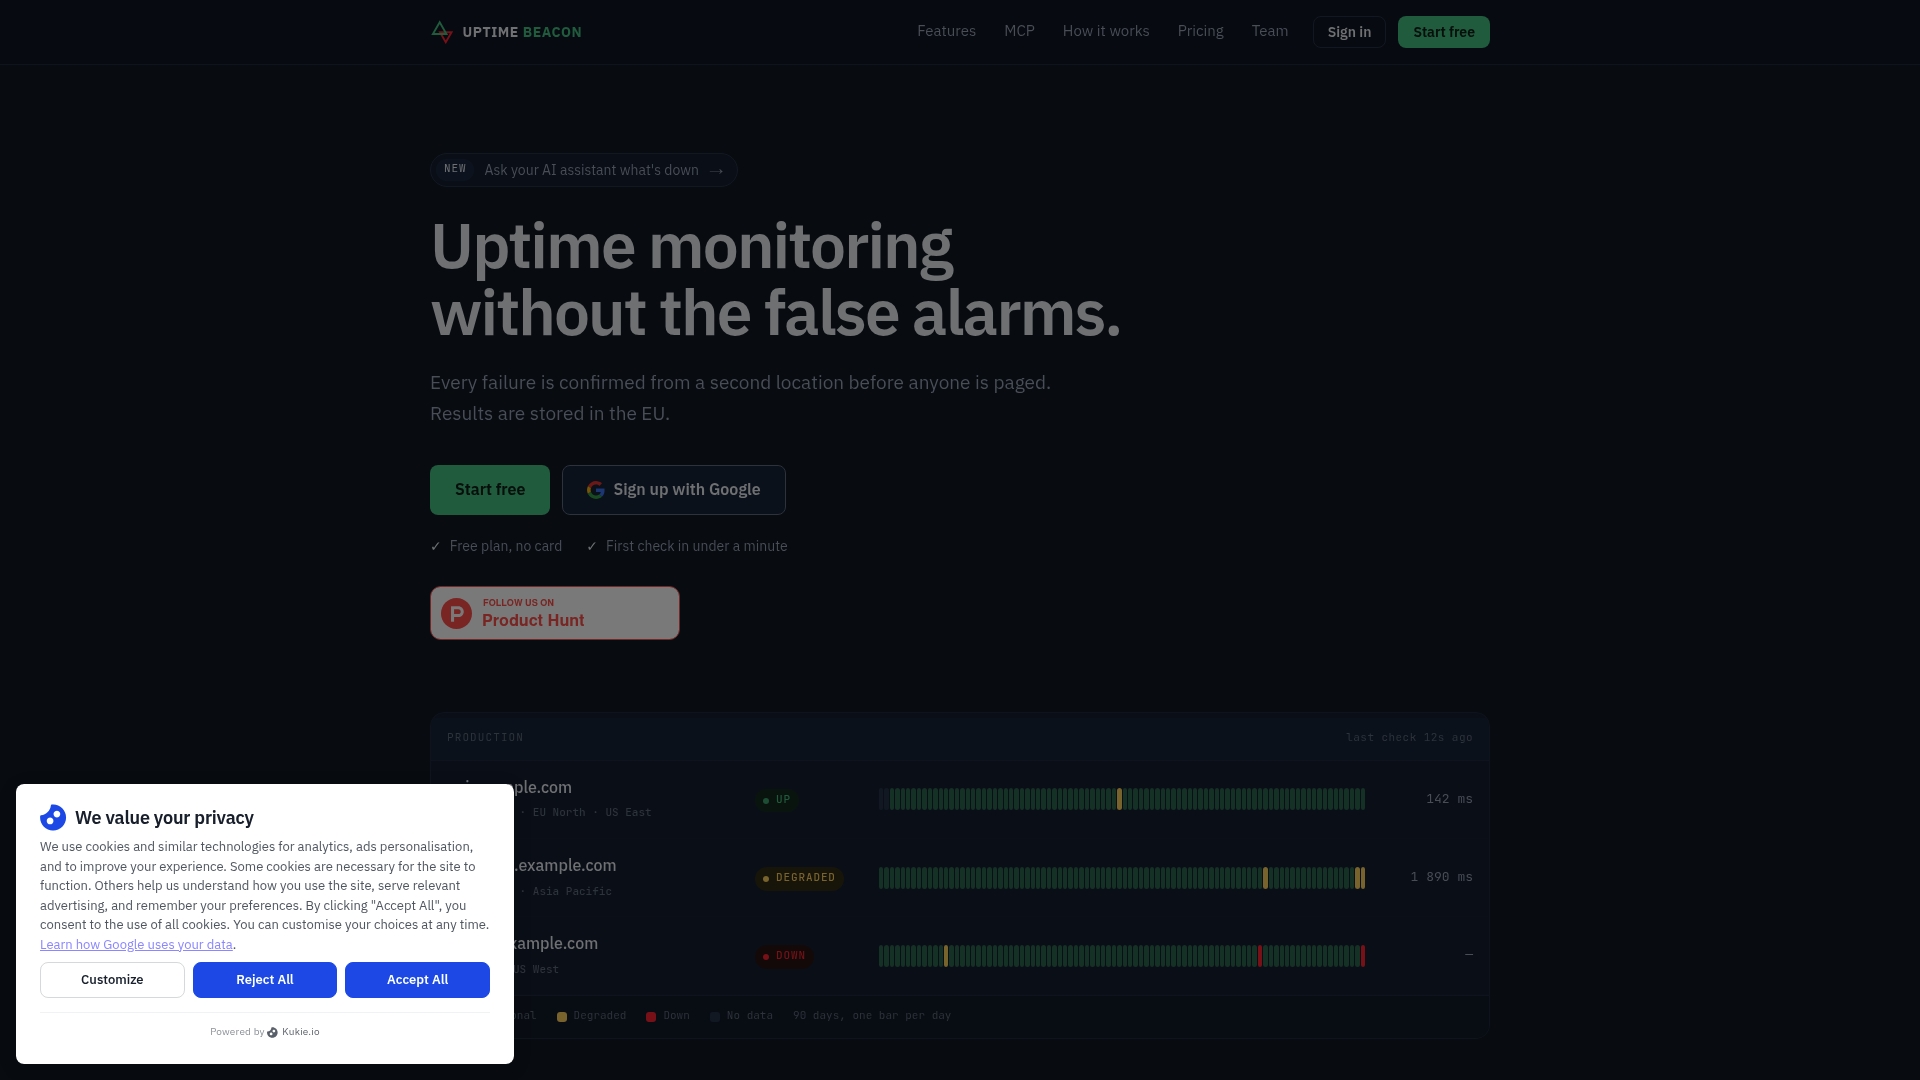
Uptime Beacon is built for engineers and small teams who carry the pager. It checks HTTP endpoints, TCP ports and hosts from five regions: EU Central, EU North, US East, US West and Asia Pacific. Its core design choice is that an incident opens only after several failures in a row, and on paid plans the failure is confirmed from a second location. A network blip on one route should not wake anyone.
The second difference is AI assistants over MCP on every plan, Free included. You connect Claude, ChatGPT, Cursor, VS Code, Codex or any MCP client to https://app.uptimebeacon.eu/mcp, sign in, and there is no API key to manage. The assistant can read monitors, incidents and check history, and diagnose a failing monitor region by region. With “Allow changes” turned on for a team, it can also create, pause and resume monitors, acknowledge incidents and start maintenance windows. Nothing can be deleted over MCP.
Also included: heartbeat monitoring for cron jobs, certificate and domain expiry watches, public status pages that do not depend on the dashboard, and maintenance windows on Starter and above. Alerts go out by email, Slack or webhook. Every result is stored on a control plane and database in the EU, and the service is operated by Wealth Beacon OÜ in Estonia.
Best for: solo developers, startups, SaaS teams, agencies and anyone who wants reliable uptime and endpoint checks without alert fatigue. For SaaS-specific setups, see API and cron monitoring for SaaS teams.

UptimeRobot: simple and quick
Thunderbit describes UptimeRobot as the simple option, with setup estimated at 2 to 5 minutes, and it names it as a general fit for solo developers who want straightforward uptime. If your need is “tell me when this URL stops answering,” that simplicity is the appeal. Check its own pricing page for current limits.
Checkly and Postman: deeper checks and workflows
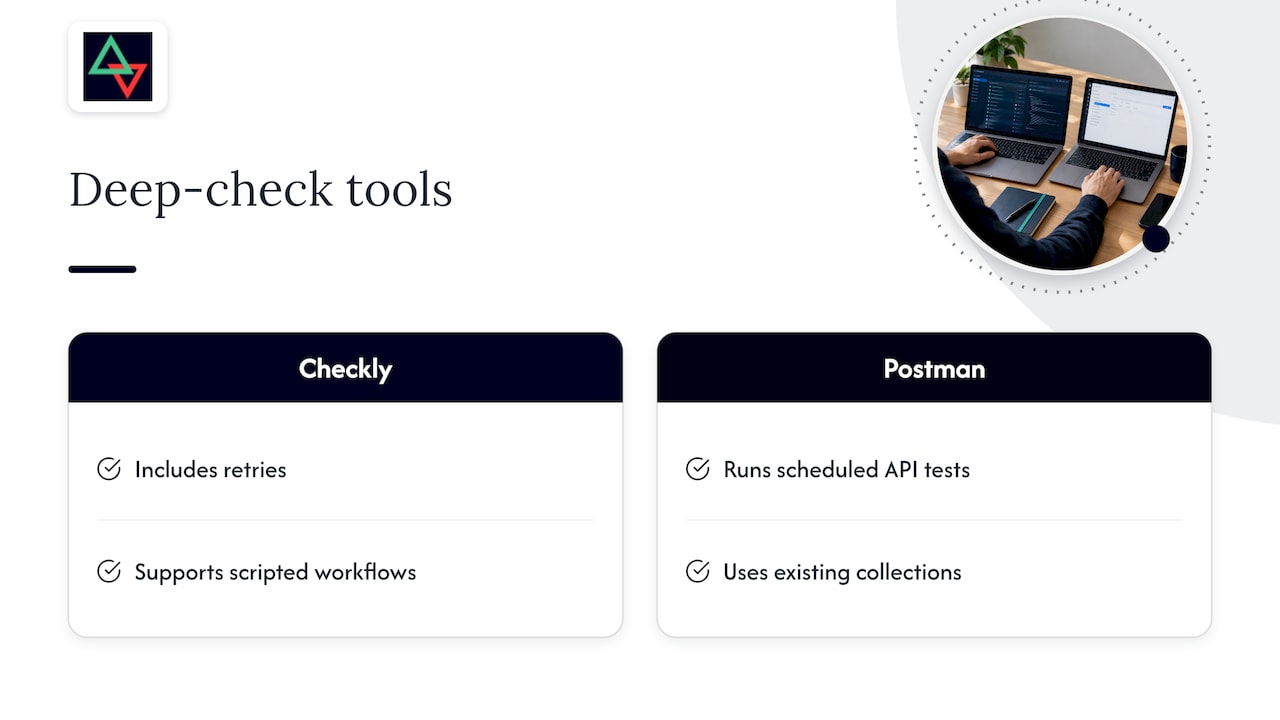
When the question shifts from “is it up” to “does the login-then-create-order flow still work,” you need scripted, multi-step checks. Thunderbit groups Checkly and Postman as the tools supporting deeper checks and workflows, and says small teams can favor them. It also reports that Checkly includes retries. Postman’s monitors run scheduled API tests, which suits teams that already keep their collections there.
The trade-off is setup effort: scripts and collections have to be written and maintained as the API evolves.
Better Stack: incident and on-call workflows
Thunderbit characterizes Better Stack as adding incident and on-call workflows, including escalation and routing. That makes it relevant for teams whose main problem is who gets paged and when, not only whether an endpoint is down.
Datadog and New Relic: full-stack observability
Datadog links API performance with infrastructure metrics, and Thunderbit places Datadog and New Relic among the broader observability platforms, noting Datadog anomaly detection and New Relic flapping suppression. They fit larger operations that want traces, logs, metrics and API checks in one place. For a small team that only needs endpoint monitoring, the breadth can be more than the job requires.
SmartBear AlertSite, Moesif, Sematext, Treblle and API Context
The Zuplo roundup covers several more names. SmartBear AlertSite is enterprise synthetic monitoring with global coverage and multi-step transaction tests. Moesif pairs API monitoring with user behavior analytics. Sematext unifies APIs, logs and infrastructure. Treblle offers real-time visibility across APIs, and API Context runs continuous synthetic performance checks from just a URL. These lean toward analytics and enterprise needs rather than pager-first uptime.
Uptime Kuma, Prometheus and Grafana: self-hosted
If you want no license fee, open source is the route. Thunderbit points solo developers to Uptime Kuma for free self-hosting and Gatus for configuration-driven open source. Prometheus with Grafana is the flexible, self-managed option, with PromQL rules and Alertmanager features for grouping, deduplication, silencing and inhibition. The same source reports that Grafana Cloud offers up to 100,000 API-test executions per month on its free tier.
The catch is operational. If you self-host, you manage the infrastructure and ongoing maintenance yourself. There is also a structural weakness: a monitor that runs on your own servers can fail together with the thing it watches.
Side-by-side comparison
| Tool type | Examples | Check depth | Strength | Main cost |
|---|---|---|---|---|
| Uptime and endpoint monitoring | Uptime Beacon, UptimeRobot | HTTP, TCP, host checks | Fast setup, clear alerts | Limited scripting |
| Synthetic and workflow testing | Checkly, Postman | Assertions, multi-step flows | Tests real user journeys | Scripts to maintain |
| Incident and on-call | Better Stack | Uptime plus escalation | Routing and escalation | Another platform to adopt |
| Full observability | Datadog, New Relic | Metrics, traces, logs | One place for everything | Breadth and complexity |
| Self-hosted | Uptime Kuma, Prometheus + Grafana | Varies | No license fee, full control | You operate it |
Check each vendor’s pricing page for current numbers before you decide. Plans and limits change, and the right comparison is the one you run on the day you buy.
Why false alarms deserve their own column
A monitoring tool that cries wolf trains your team to ignore it. A single failed request can come from a transient network issue between the checker and your server, not from your API. Three habits cut this noise:
- Require consecutive failures. One failed check is a data point, not an incident.
- Confirm from a second location. If only one region sees the failure, the problem may be the route, not your service.
- Group and deduplicate. One outage should produce one page, not fifty.
This is the design Uptime Beacon is built around. Our guide on reducing alert noise without missing real incidents goes deeper, and SaaS uptime monitoring shows how it plays out for teams that page on real failures only.
Which tool for which team
- Solo developer or indie hacker. You need something running in minutes and free. A free plan from a hosted tool, or Uptime Kuma if you enjoy running your own services.
- Startup or small SaaS team. You need reliable alerts, status pages, cron monitoring and certificate watches without a dedicated platform engineer. Hosted uptime monitoring with confirmation logic fits.
- Agencies and freelancers. Many monitors across many client sites, plus a public status page per client. Look at monitor limits and add-on pricing first.
- Teams with complex API flows. Add a scripted-check tool like Checkly or Postman on top of uptime monitoring.
- Larger on-call organizations. Consider incident-management and observability platforms.
- EU data residency requirements. Ask each vendor where results are stored, and get the answer in writing from their own documentation.
Most teams end up layered: a lightweight external uptime layer that pages reliably, and a deeper layer for the flows that matter most. Our API monitoring best practices guide describes how to build that stack step by step.
Switching from another tool
If you are moving from UptimeRobot, Pingdom or Better Stack, the work is mostly inventory. List your current monitors with their URLs, intervals and expected status codes. Note your alert channels and who receives what. Rebuild the critical monitors first, run old and new tools side by side for a week, then compare which one alerted on real incidents and which one on noise. Retire the old tool once the new alerts have proven themselves on your own traffic.
Our perspective
We run, and have long run, production systems in banking, fintech, telecom and SaaS. The lesson we keep coming back to is that the monitoring tool most teams regret is not the one with too few features. It is the one that pages them for nothing.
That is why Uptime Beacon opens an incident only after several failures in a row, and on paid plans confirms it from a second location before anyone is woken. A pager that is right most of the time gets answered. A pager that is wrong often gets muted.
The second shift is how engineers work now. Many of you ask an AI assistant what is wrong before you open a dashboard. So we built an MCP server into every plan, Free included. Your assistant can read monitors and incident history and diagnose a failing monitor region by region, and nothing can be deleted over MCP.
Last, we store every result in the EU. For teams with GDPR obligations, that removes a question before it is asked.
Aaditya Parashar
Try Uptime Beacon free
The Free plan is 5 monitors checked every 5 minutes from EU Central, with one alert channel (email or Slack) and one status page. No card is needed, and the MCP server is included.
When you need more, Starter is €14.99 per month, Pro is €39.99 per month and Business is €89.99 per month, with Enterprise available on request. Add-ons start from €5 per month: for example, 10 more monitors on Starter for €5 per month, 50 more on Pro for €10 per month or 100 more on Business for €15 per month. See all plans on the Uptime Beacon site and start with the monitors that matter most.
FAQ
What is the difference between API monitoring and API testing?
Testing runs before release to check that code behaves as intended. Monitoring runs continuously against the live API to tell you when availability, speed or correctness drops. Some tools, such as Postman, let you reuse tests as scheduled monitors, so the line is blurry in practice.
Do I need API monitoring if I already have logging?
Yes. As the NCSC guidance explains, logs are the retrospective record for investigation, while monitoring is the real-time view that tells you something is wrong now. Logs rarely page you when your API is unreachable, because an unreachable API may produce no logs at all.
How often should I check an API?
Match the interval to the cost of downtime. A five-minute interval is a reasonable baseline for many services, and revenue-critical endpoints justify tighter checks. Pair the interval with consecutive-failure rules so frequent checks do not mean frequent false alarms.
Can I monitor cron jobs and certificates with the same tool?
With Uptime Beacon, yes. Heartbeat monitoring covers cron jobs and background workers, and certificate and domain expiry watches are included, so one account covers the common ways an API quietly breaks.
Is free API monitoring enough?
For a side project or an early product, often yes. Uptime Beacon’s Free plan covers five monitors with email or Slack alerts and a status page. As you add clients, endpoints or on-call rotation, paid plans add second-location confirmation and maintenance windows.
Sources
- Securing HTTP-based APIs: logging and monitoring (UK NCSC)
- What Is API Monitoring? (CloudSEK)
- Best monitoring tools for APIs (CodeWords)
- Best API Monitoring Tools: What Devs Actually Use in 2026 (Thunderbit)
- 8 API Monitoring Tools Every Developer Should Know (Zuplo)


