Network monitoring watches the machinery between your systems: switches, links, traffic and device health. Uptime monitoring asks one question from outside: can a user reach your website, API or job right now? If you run a production service and carry the pager, uptime monitoring is the one that tells you customers are affected, and network monitoring is the one that helps you find out why. Most small teams need uptime checks first, and add network visibility when they own hardware or a private network.
This guide explains the difference in plain terms, shows what each one misses, and helps you decide what to run. At Uptime Beacon we build the uptime side, so that is where the practical detail goes.
TL;DR
- Network monitoring observes devices, links and traffic inside a network (the infrastructure view). Uptime monitoring tests whether a service answers from outside (the user view).
- Uptime is a percentage: time up divided by total time. 99.9% allows about 8.76 hours of downtime a year; 99.99% allows about 52.56 minutes.
- Each approach has blind spots. A healthy network can carry a broken application, and a passing ping can hide a failing login page.
- A single failed check is not an outage. Confirmation from a second location is what keeps your pager quiet during a network blip.
- Small teams running websites, APIs and cron jobs usually start with uptime monitoring. Teams that own switches, routers or private links add network monitoring.
Table of Contents
- What network monitoring actually watches
- What uptime monitoring actually watches
- Network monitoring vs uptime monitoring, side by side
- What uptime means, and how it is calculated
- Why check design changes the number
- What each approach misses: a worked scenario
- When to use network monitoring, uptime monitoring, or both
- Monitoring from several regions
- Where monitoring data lives
- Our perspective
- Start with the uptime layer
- FAQ
- Sources
What network monitoring actually watches
Network monitoring means overseeing a network’s performance, availability and overall functionality so you can find and fix problems. In practice it collects data from the devices that move traffic: routers, switches, firewalls, access points and servers. Typical signals are bandwidth use per port, packet loss, latency, interface errors, CPU and memory on network gear, and device up or down status.
A concrete example comes from the Wireless Networking in the Developing World chapter on network monitoring. An administrator of a network with 50 computers and three servers (email, web and proxy) used SNMP-enabled switches (SNMP is a standard protocol that lets devices report their counters) together with the free MRTG tool to graph the traffic on each switch port. The graphs showed the internal LAN carrying far more traffic than the Internet connection could account for, even when the office was empty. That pointed to a network virus. After cleanup, traffic returned to expected levels, machines ran faster and spam dropped.
Notice what made that discovery possible: continuous measurement of the inside of the network. No outside check would have flagged it, because the website was never down.
Network monitoring is the right tool when you own or lease the network layer: an office, a data center rack, a branch connection, a private link between sites. It answers questions such as which port is saturated, which link is dropping packets and which device is about to fail.
What uptime monitoring actually watches
Uptime monitoring takes the opposite position. It stands outside your systems, behaves like a user or a client, and asks whether the thing you promise is available. The common check types are:
- HTTP checks request a URL and verify the status code, and often the response time.
- TCP port checks confirm that a service such as a database proxy or mail server accepts connections.
- Host checks confirm a machine responds.
- Heartbeat checks work in reverse: a cron job or background worker pings the monitor when it finishes, and silence raises the alarm.
- Certificate and domain expiry watches warn you before a TLS certificate or a domain registration lapses.
Uptime monitoring does not care how many switches sit between the probe and your server. It cares about the outcome. If the page loads and the API answers, you are up. If not, you are down, whatever the dashboards inside say.
That outcome focus is why uptime figures end up in contracts and status pages. Businesses that promise availability to clients need a number that matches what clients experience, and an external check is the closest measurement to that.
Network monitoring vs uptime monitoring, side by side
| Network monitoring | Uptime monitoring | |
|---|---|---|
| Viewpoint | Inside the network | Outside, like a user |
| Observes | Devices, links, bandwidth, packet loss, latency, interface errors | Whether a URL, port, host or job responds correctly |
| Typical data source | SNMP, flow data, device agents | HTTP, TCP and heartbeat probes from several regions |
| Best at | Finding why something is slow or failing | Knowing that something is failing, and for how long |
| Who needs it most | Teams that own switches, routers and private links | Anyone who runs a website, API or scheduled job |
| Output | Utilization graphs, device health, capacity trends | Incidents, response times, uptime percentage, status page |
| Main blind spot | A healthy network says nothing about whether the application works | A failing check says something is wrong, not which layer broke |
The two are not rivals. One tells you a user is hurting; the other helps you locate the cause. If you can only afford attention for one, pick the one closer to the customer.
What uptime means, and how it is calculated
People searching for “uptime in networking” usually want the formula. TechTarget defines network availability as the percentage of time a system stays fully operational over a set period: uptime divided by total time, where total time is uptime plus downtime, and downtime includes maintenance, unplanned failures and recovery time. High availability setups typically strive for 99.999%.
The arithmetic is simple. A year has 8,760 hours. If a service is unavailable for 10 of them, it was up for 8,750, and 8,750 divided by 8,760 is 99.885%.
Here is what common targets allow per year, calculated from that formula:
| Target | Downtime allowed per year |
|---|---|
| 99% | about 87.6 hours |
| 99.9% | about 8.76 hours |
| 99.99% | about 52.56 minutes |
| 99.999% | about 5.26 minutes |
The last row matches Cisco’s explanation of five-nines availability, which describes the end user perceiving the application as available 99.999% of the time, with only 5.26 minutes of downtime a year. The same post builds availability from two measures: MTBF (mean time between failures) and MTTR (mean time to recovery). Our own guides go deeper on what 99.9% uptime really allows, the SLA uptime formula and why one outage can produce three different MTTRs.
Two practical points follow. First, decide up front what counts as downtime, including planned maintenance, because the answer changes the percentage. Second, the number is only as honest as the checks behind it.
Why check design changes the number
Uptime percentages look exact, yet they depend on how often you probe and how you treat edge cases. Metabase’s uptime metrics guide points out that a 5-minute probe interval can miss a 4-minute outage entirely, or round a 90-second blip up to five minutes of downtime. It also notes that 99.99% cannot be measured reliably with coarse probes, and that silently subtracting maintenance windows is how 99.5% gets published as 99.95%. Its advice is to flag maintenance windows and publish raw and adjusted uptime side by side.
A second source of error is the probe itself. One sample from one place can fail for reasons unrelated to your service: a congested path, a dropped packet, a resolver hiccup. The idea of taking several samples rather than trusting one applies to any availability check, not only to the proxy case that article covers.
This is the central design problem in uptime monitoring, and it is where tools differ most. The answer we built Uptime Beacon around is to require several failures in a row before an incident opens, and on paid plans to confirm the failure from a second location. A local network blip then fails one probe and nothing more. A real outage fails from both places and pages you.
If you want the setup details, our uptime monitoring guide walks through intervals, thresholds and confirmation, and our downtime notification policy guide covers who gets told what, and when.
What each approach misses: a worked scenario
Imagine a small SaaS company. Its API runs on a cloud provider, its marketing site sits behind a CDN, and a nightly cron job sends invoices.
Scenario 1: the database connection pool is exhausted. Every network device is healthy. Bandwidth is flat, latency is normal, ping answers. Yet the API returns 500 errors on every request. Network monitoring shows green. An HTTP check that expects a 200 response from a real endpoint fails within minutes.
Scenario 2: a switch port starts dropping packets. The website still loads, just slowly and intermittently. Uptime checks pass most of the time and the percentage barely moves. Network monitoring shows interface errors climbing, which is the early warning you want.
Scenario 3: the invoice job silently stops. Nothing is down. No port is closed. No page errors. Neither network monitoring nor a plain HTTP check notices. A heartbeat monitor does: the job should have checked in by 02:15 and did not.
Scenario 4: a TLS certificate expires on Saturday. The network is fine and the server is running, but browsers refuse the connection. An expiry watch would have warned you weeks earlier.
The lesson is that no single check covers everything. Match the check to the failure you fear. Ping or TCP tells you a host or port is reachable, which is a low bar. An HTTP check with a content or status expectation tells you the application is behaving. A heartbeat tells you scheduled work happened. Our cron job monitoring guide covers the last one, and the website downtime diagnosis guide shows how to work from symptom to cause.

When to use network monitoring, uptime monitoring, or both
Use this as a decision rule.
Start with uptime monitoring if:
- You run a website, SaaS product, API or client sites and your infrastructure is mostly hosted by someone else.
- You make availability promises to customers and need an incident record and a status page.
- You are a solo developer, a freelancer or a small team without a network engineer.
- You run cron jobs and background workers that fail silently.
Add network monitoring if:
- You operate your own switches, routers, firewalls or a private link between offices or data centers.
- You need capacity planning: which links are filling up, and when.
- Intermittent slowness keeps appearing and uptime checks pass, which usually means the problem sits below the application.
Run both if:
- You have a hybrid setup, with on-premises hardware serving a public product. Uptime monitoring detects customer impact; network monitoring explains it. For a deeper look at the network side, this overview of troubleshooting network downtime in business settings shows how problems are traced once you know where to look.
A healthy order of operations for an incident is: the uptime alert says the service is down for users, then you check the network graphs and application logs to find the layer at fault. Alerting from outside first keeps the signal clean. Alerting on every internal metric first produces the noise that trains engineers to ignore pages.
Monitoring from several regions
A service can be reachable from Frankfurt and unreachable from Virginia. A single probe location cannot see that. Uptime Beacon checks HTTP endpoints, TCP ports and hosts from five regions: EU Central, EU North, US East, US West and Asia Pacific. When an alert fires, the region-by-region view shows whether the failure is global or local, which is the first question an on-call engineer asks.
That view is also where the line between network and uptime monitoring blurs usefully. A failure that appears from one region only often points to routing or a regional network problem rather than your application, which tells you where to look before you open a single log file.
Where monitoring data lives
If you serve customers in the EU, or you are an EU company with GDPR obligations, it is worth knowing where your monitoring results are stored. Check results include hostnames, response data and incident history, so the location of the control plane and database matters to compliance reviews. Uptime Beacon stores every result on a control plane and database in the EU, and is operated by Wealth Beacon OÜ in Estonia. Checks themselves run from the five regions listed above, including regions outside Europe, and the results are kept in the EU.
When you evaluate any monitoring vendor for this reason, ask three things: where the database sits, where the control plane runs, and which entity operates the service.
Our perspective
We have spent more than 30 years combined running production systems in banking, fintech, telecom and SaaS, and the pattern repeats. Teams do not burn out from outages. They burn out from pages that were not outages.
That is why we put false alarms first. A single failed probe from a single place is a rumor, not an incident. An incident should open only after several failures in a row, and on paid plans after a second location confirms it. The on-call engineer should be woken for a real problem, and only for that.
The second thing we care about is what happens after the page. Diagnosis is repetitive: which region fails, since when, what changed. So every plan, Free included, comes with an MCP server. Connect Claude, ChatGPT, Cursor, VS Code, Codex or any MCP client to https://app.uptimebeacon.eu/mcp, sign in, and there is no API key to manage. Your assistant can read monitors, incidents and check history and diagnose a failing monitor region by region. If you turn on “Allow changes” for a team, it can also create, pause and resume monitors, acknowledge incidents and start maintenance windows. Nothing can be deleted over MCP.
Last, your status page should not go down with your dashboard. Ours does not depend on it. And every result is stored in the EU.
Aaditya Parashar
Start with the uptime layer
If your goal is to know quickly and reliably whether customers can reach your service, the Free plan gives you 5 monitors checking every 5 minutes from EU Central, one alert channel (email or Slack) and one status page, with no card required. It is a practical way to cover your main site, your API and a couple of critical ports, and to try the MCP connection with your own assistant.
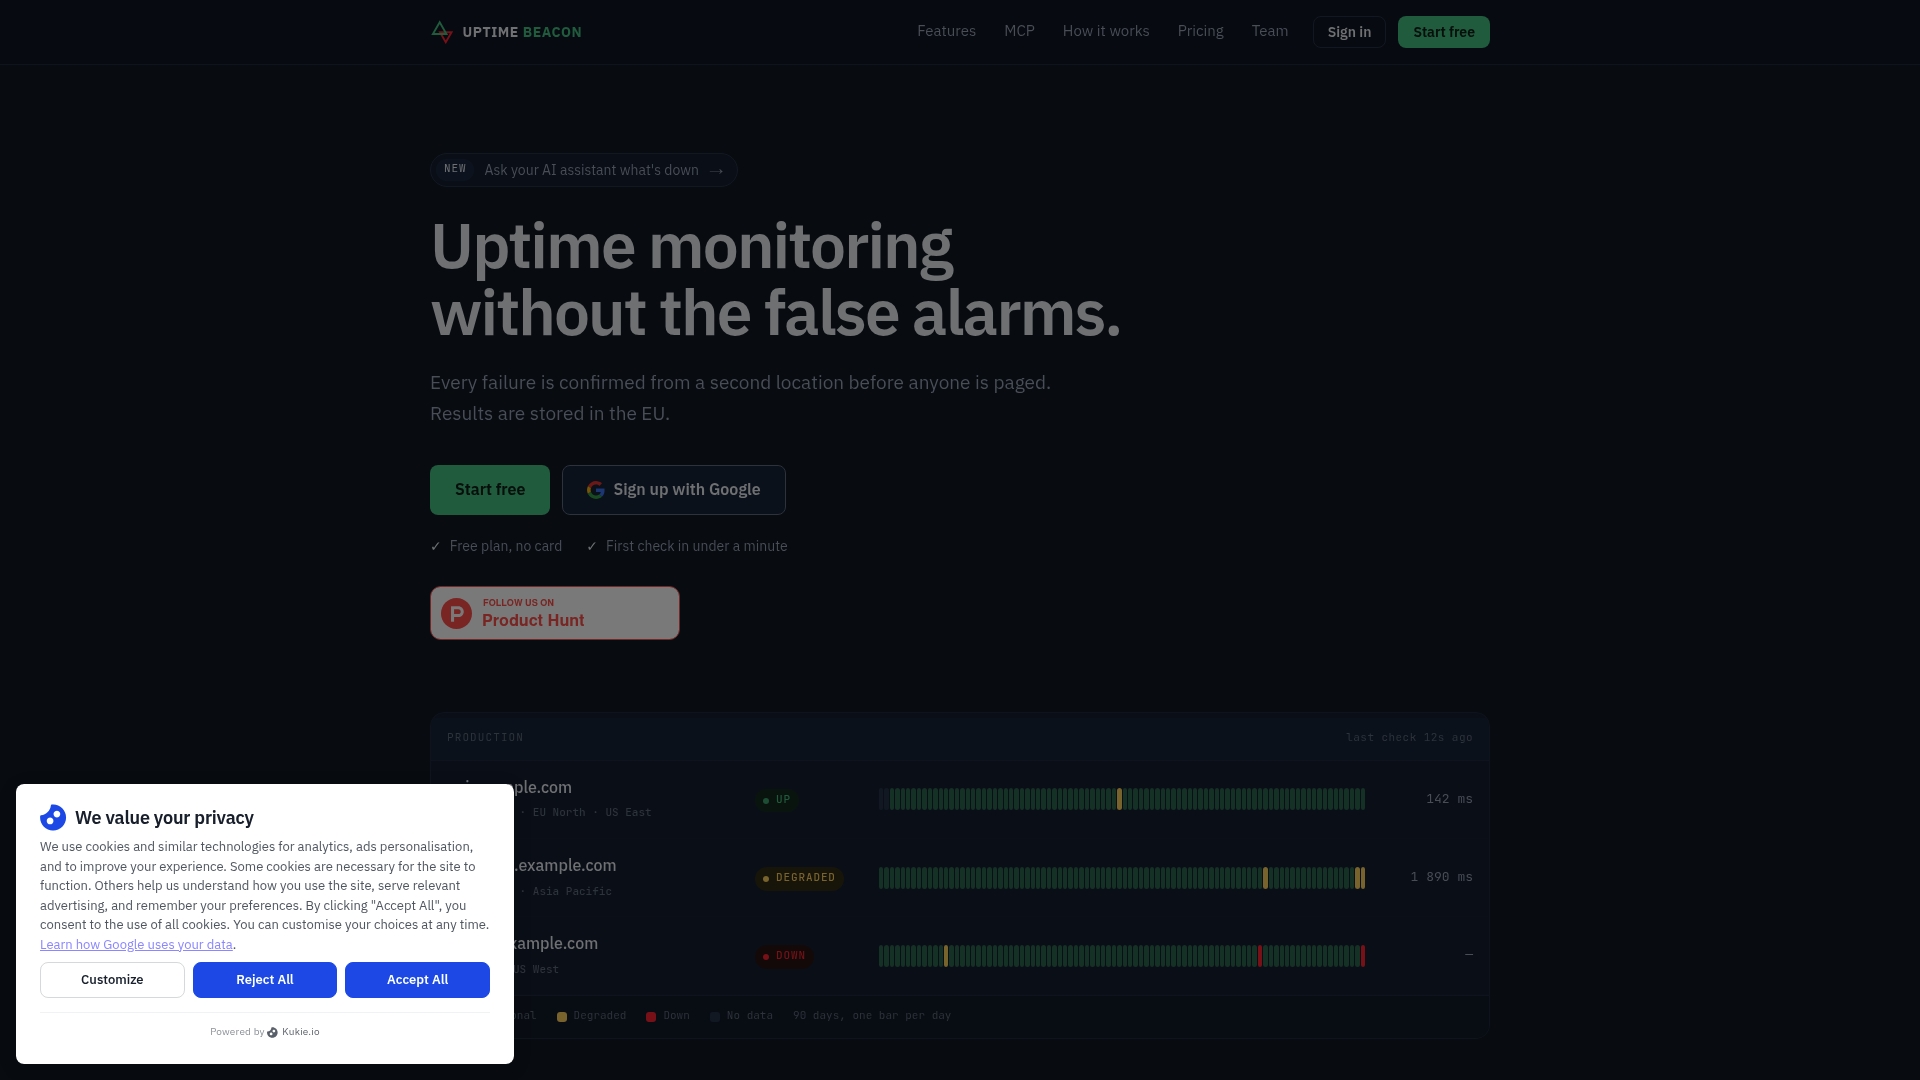
When you need more, the paid plans are Starter at €14.99 per month, Pro at €39.99 per month and Business at €89.99 per month, with Enterprise available without a published price. Starter and above add maintenance windows, and paid plans add the second-location confirmation described above. Extra capacity is sold as add-ons: 10 more monitors on Starter for €5 per month, 50 more on Pro for €10, 100 more on Business for €15, and 10 more certificate or domain expiry watches for €5. See the plans on Uptime Beacon to compare them. If you run APIs and scheduled jobs, the API and cron monitoring page for SaaS teams shows how the checks fit together.
FAQ
Is network monitoring the same as uptime monitoring?
No. Network monitoring measures the health of devices, links and traffic inside a network. Uptime monitoring checks from outside whether a service such as a website, API or job is available. They overlap when a network fault takes a service down, but they answer different questions.
What is uptime in networking?
It is the share of a period during which a system is fully operational, calculated as uptime divided by uptime plus downtime. Ten hours of downtime in a 8,760-hour year gives 99.885%. The stricter your target, such as 99.99%, the less downtime you can allow and the more precisely you must measure it.
Can I monitor my uptime without monitoring the whole network?
Yes. If your servers are hosted by a provider, you usually have no access to the underlying network anyway. External HTTP, TCP and heartbeat checks from several regions measure what your users experience, which is the number that matters for promises to clients.
Why do uptime monitors send false alarms?
Most often a single probe fails because of a transient network problem on the path between the probe and your server. Requiring several consecutive failures, and confirming from a second location, filters those out before anyone is paged.
Do I need to worry about where monitoring data is stored?
If you have GDPR or EU residency requirements, yes. Ask where the database and control plane are located and who operates them. Uptime Beacon keeps every result on a control plane and database in the EU.
Sources
- WNDW: Network monitoring chapter
- TechTarget: What is network availability?
- Cisco blog: Enterprise Network Availability
- Metabase: Uptime definition and tracking


